This article walks through E009 KeelTrack, a E009 KeelTrack trading strategy. It covers the strategy logic, signals and parameter settings, and ships ready-to-use MT4 / MT5 EAs with source download and live position tracking so you can evaluate and deploy it fast.
Magic 1070
[tv_ticker]
The Idea
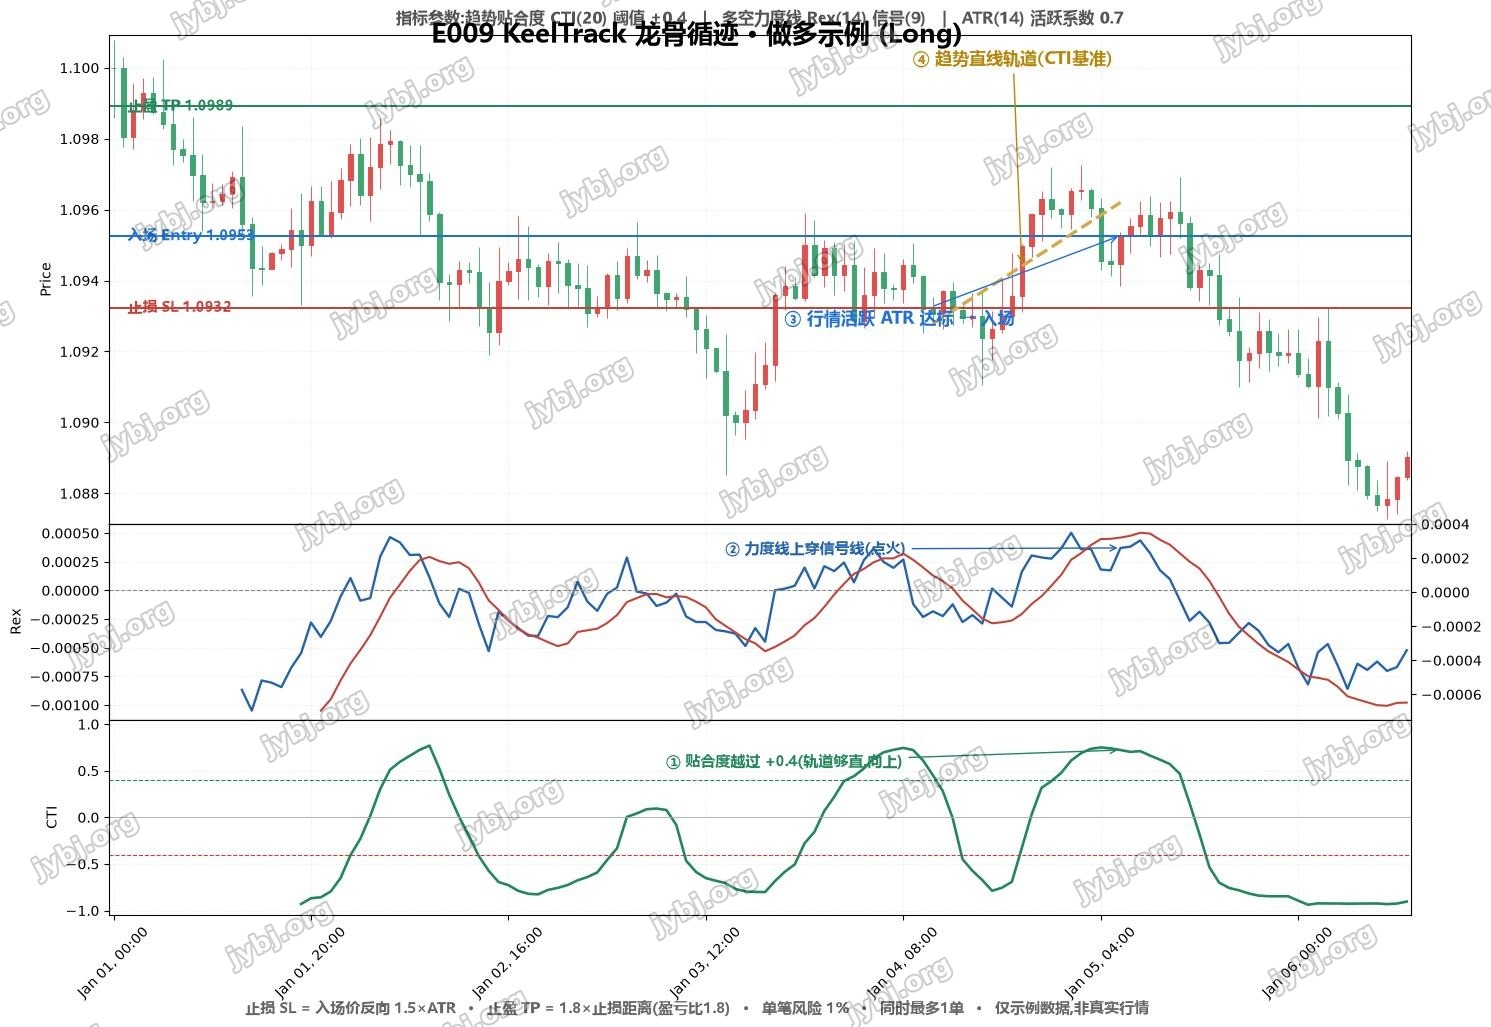
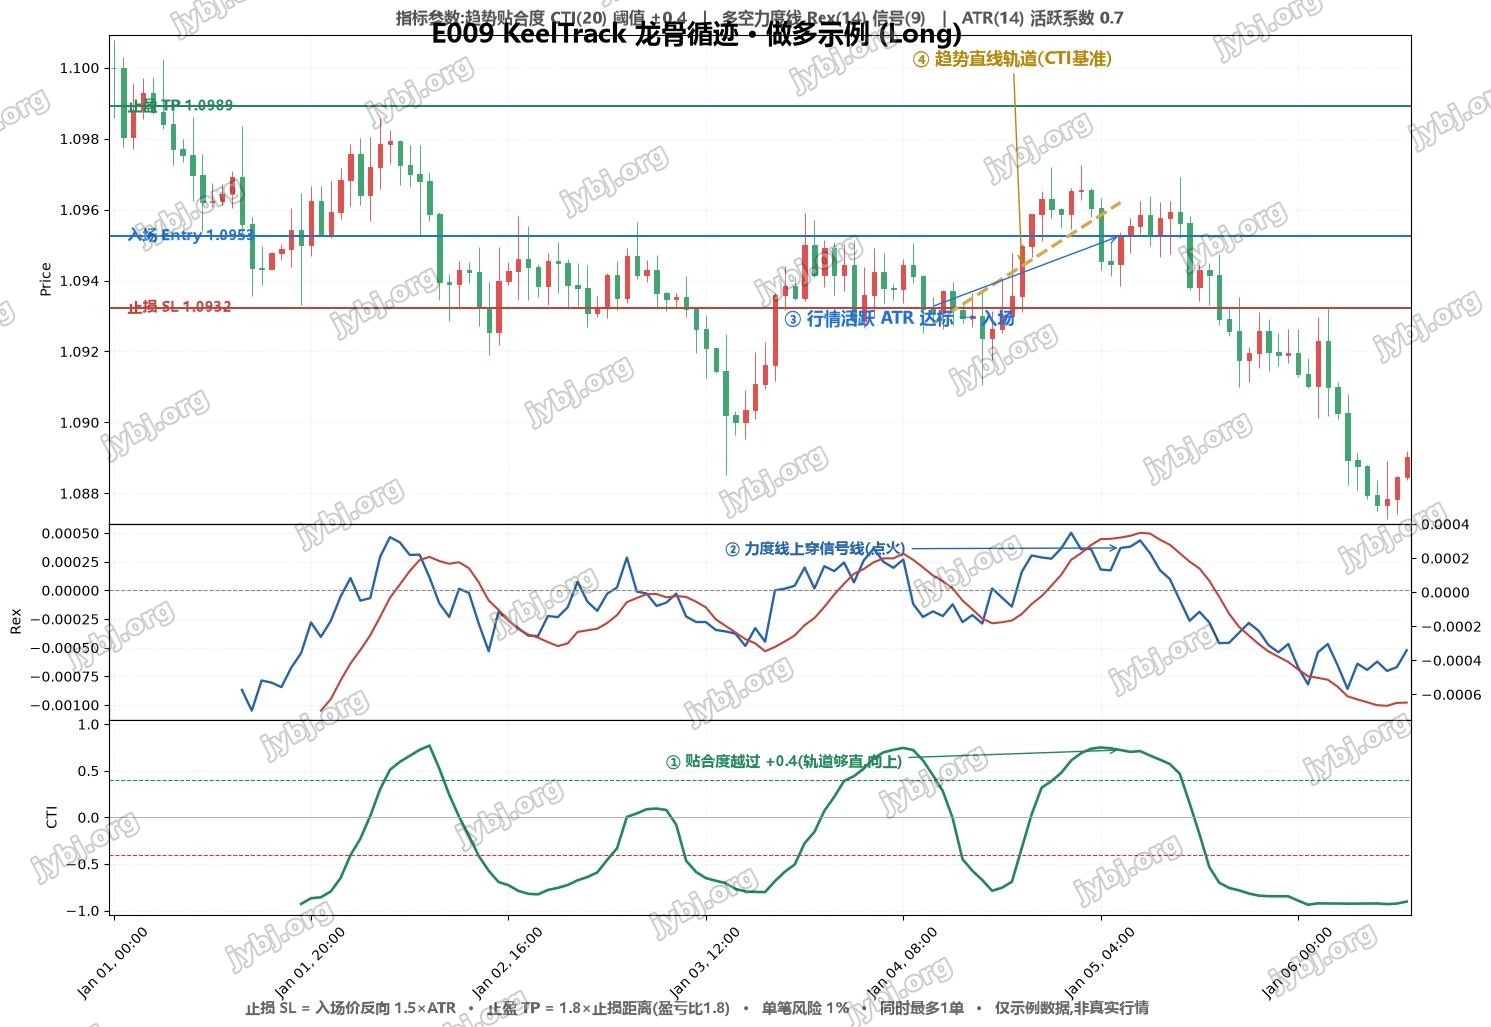
Most tools fire during sideways chop and fall silent when a clean run starts. KeelTrack flips that: it waits until price is genuinely walking in a straight line, then lets a momentum spark time the entry.
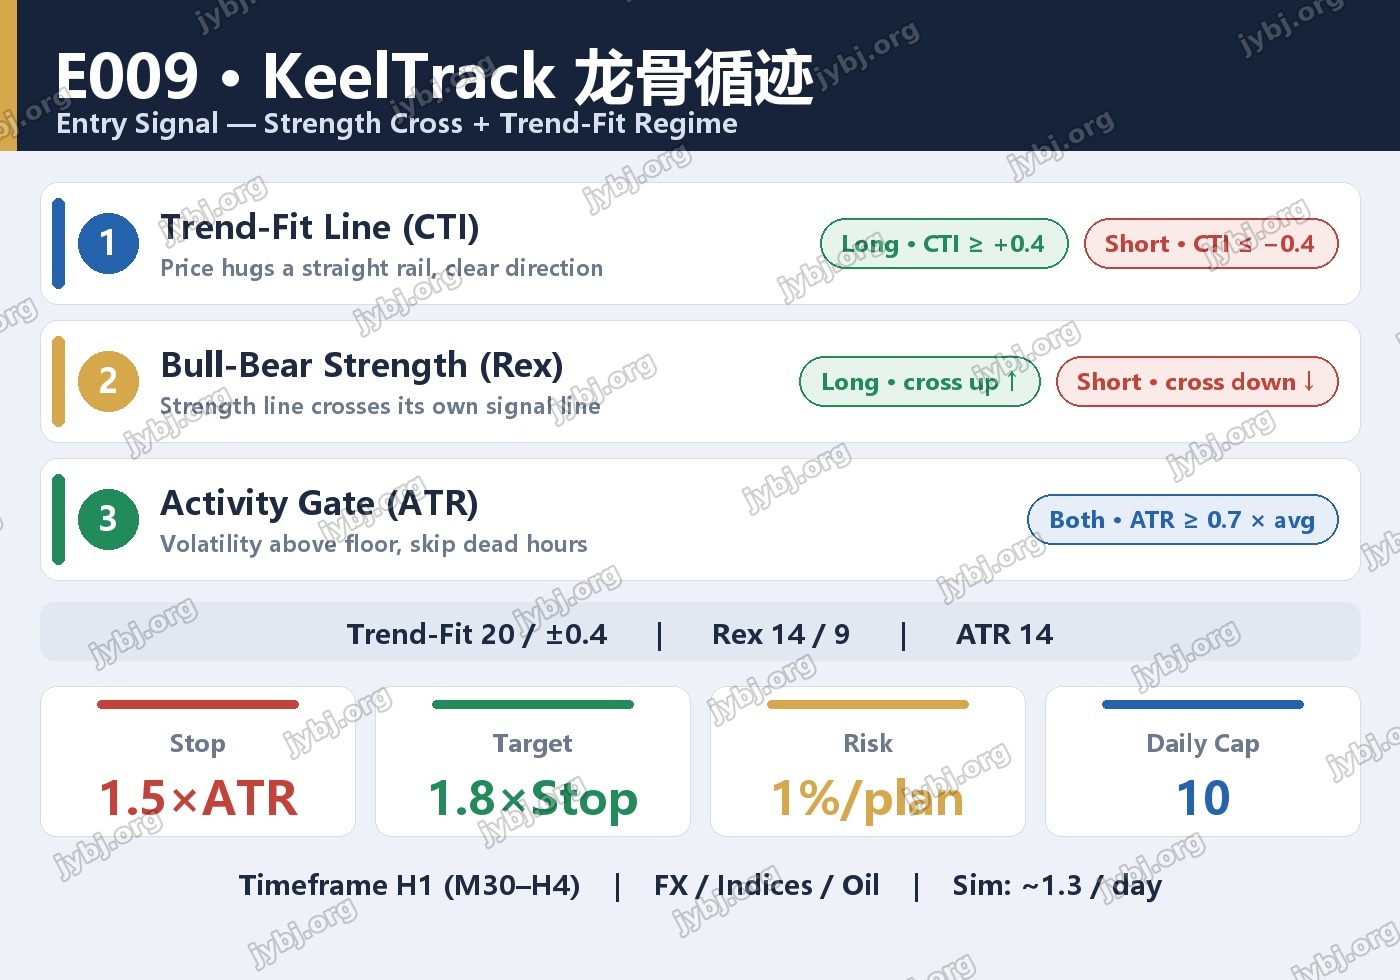
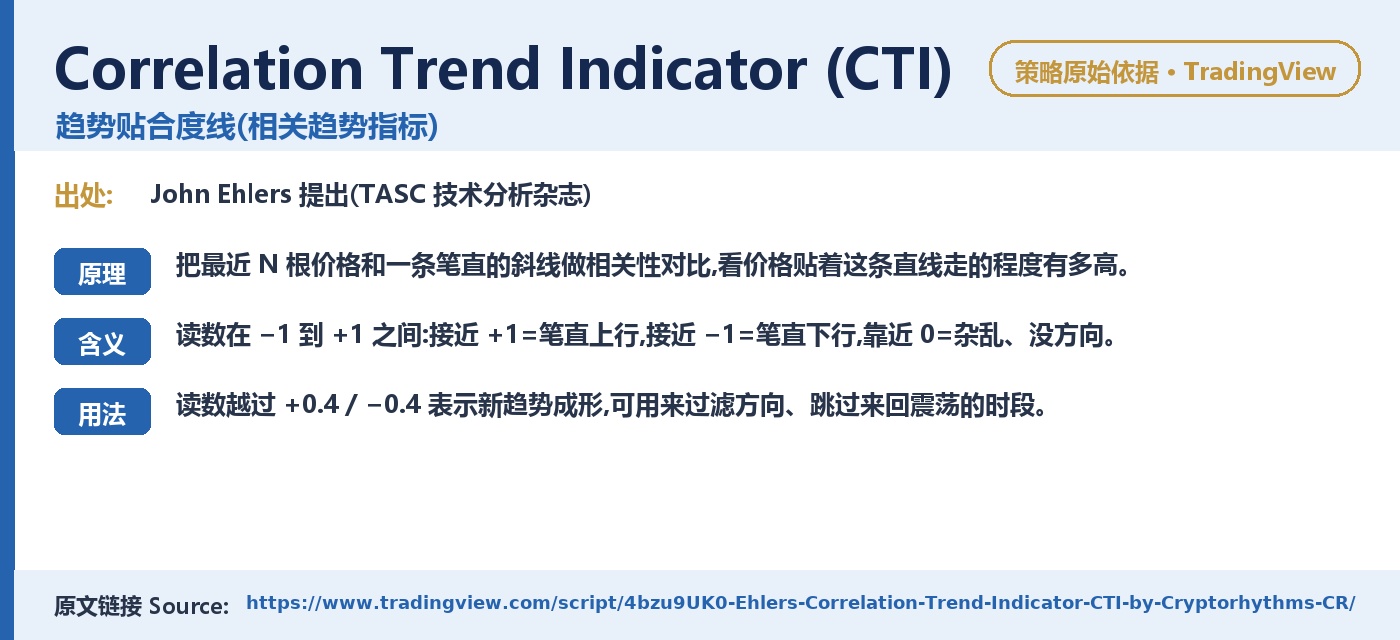
📏 Trend-Fit Line (CTI)
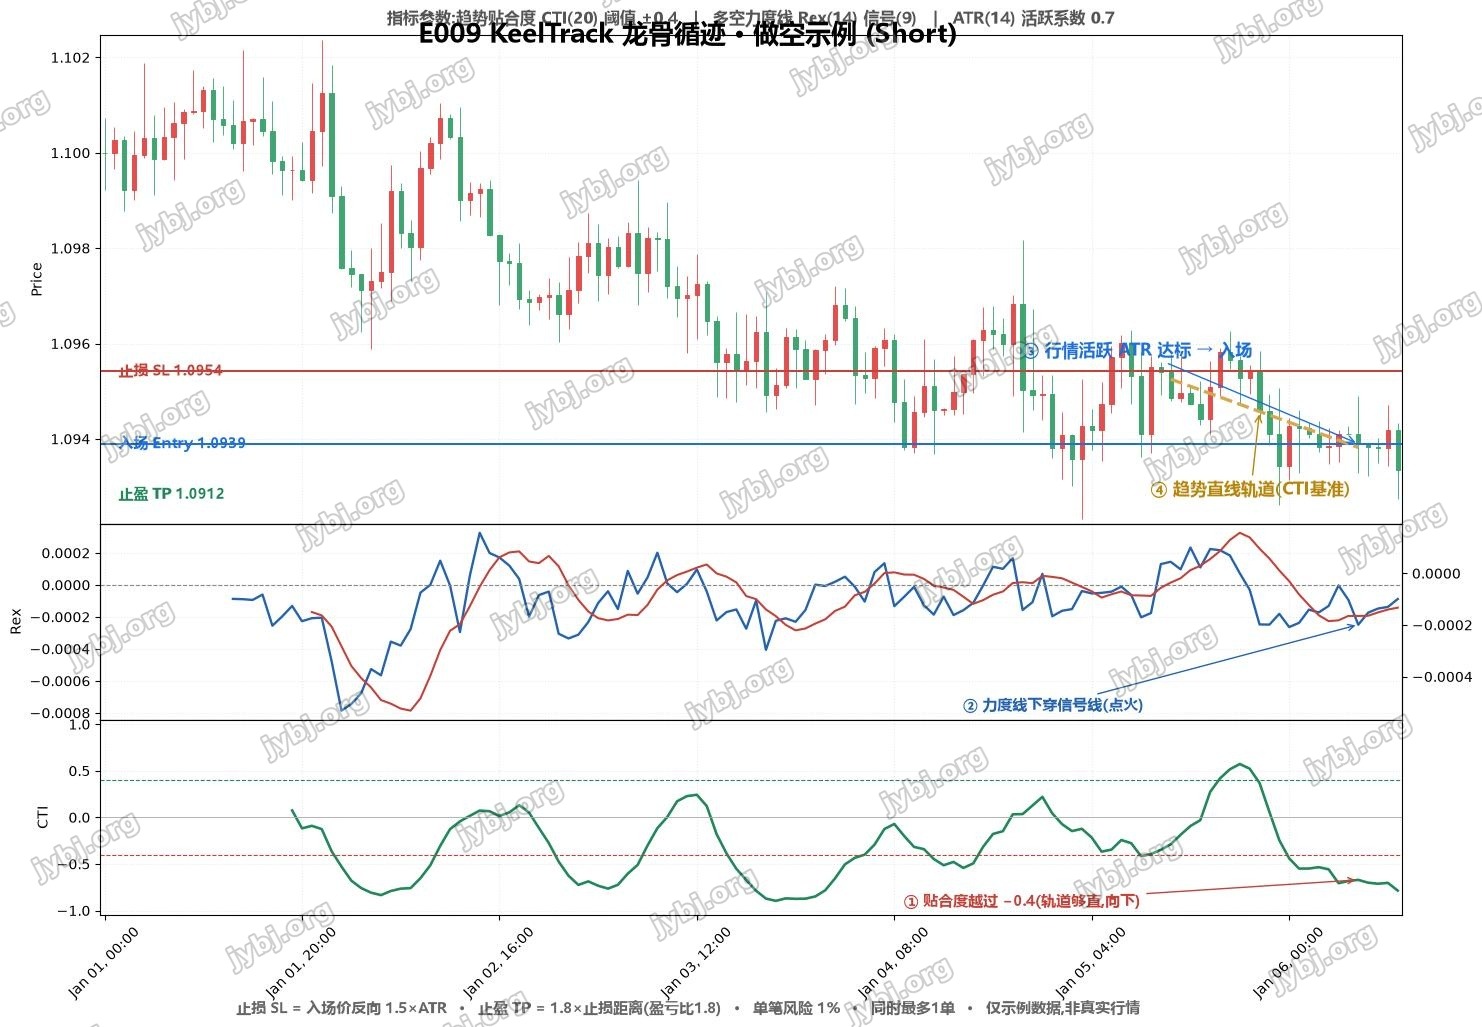
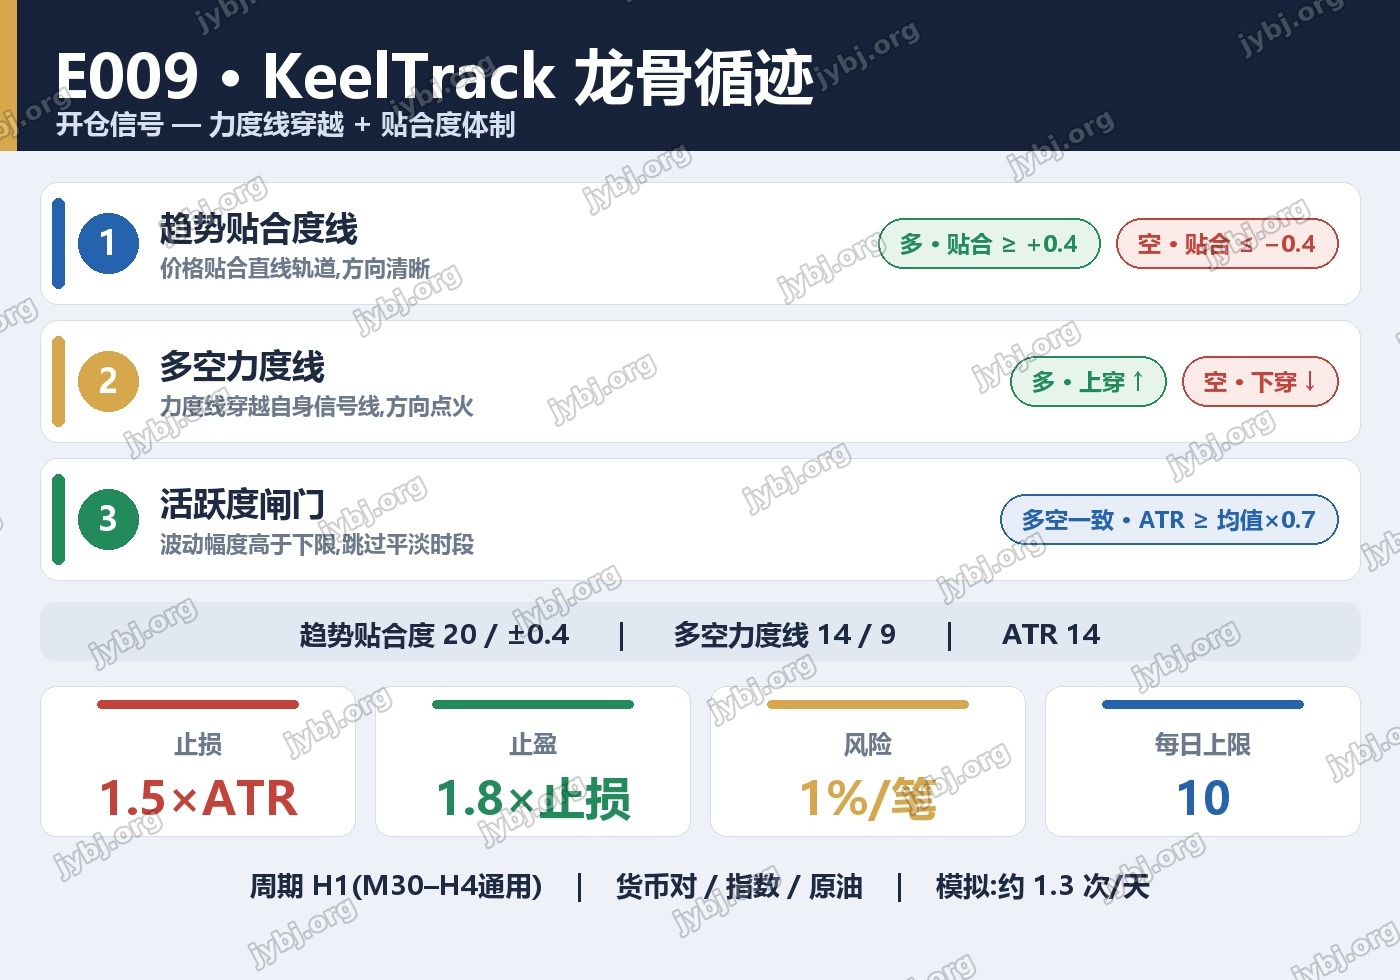
Lay a ruler on the last 20 candles. Price hugging it upward reads toward +1, downward toward −1, chop near 0. We only act beyond ±0.4 — the rail is straight enough.
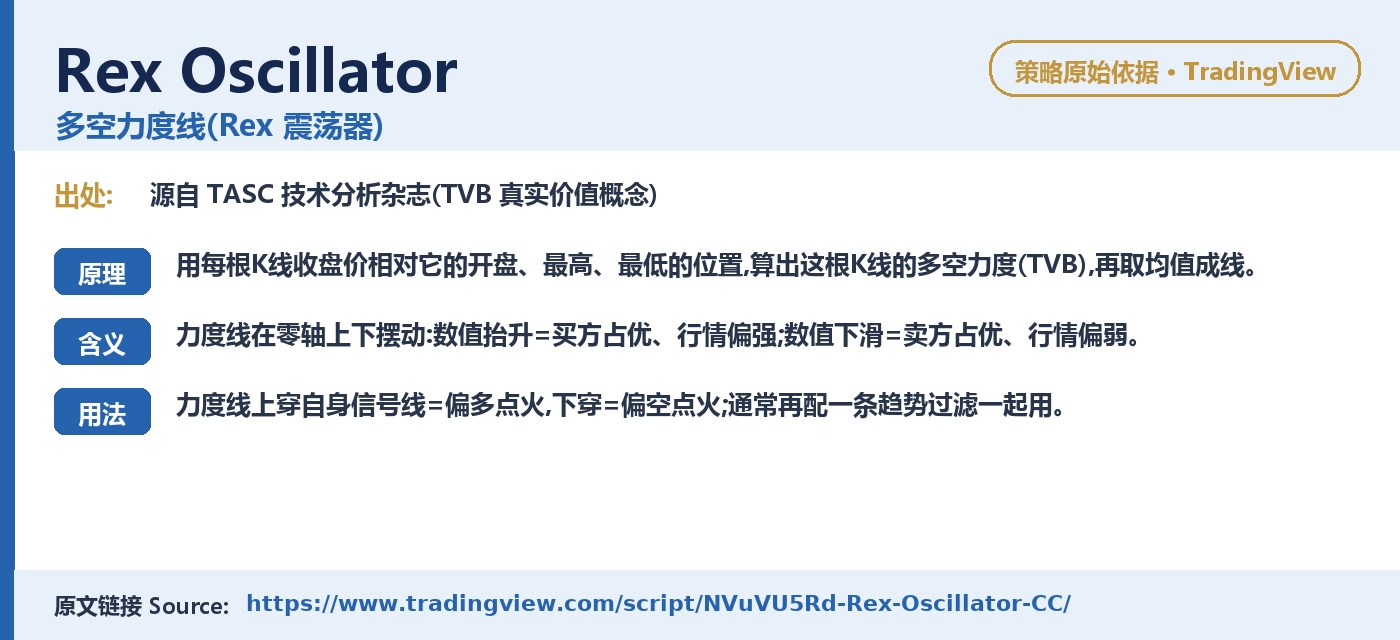
⚡ Bull-Bear Strength (Rex)
Built from where each candle closes vs its open, high and low. When the strength line crosses above its signal, buyers grabbed the wheel; below, sellers did.
🌡️ Activity Gate (ATR)
A quick volatility check — the market must be moving above a floor, so dead, flat hours are skipped.
🛡️ Portion Control
Every plan risks just 1% of the pot, a built-in counter caps it at 10 plans per day, and only one position runs at a time.
Signal at a Glance 信号判断
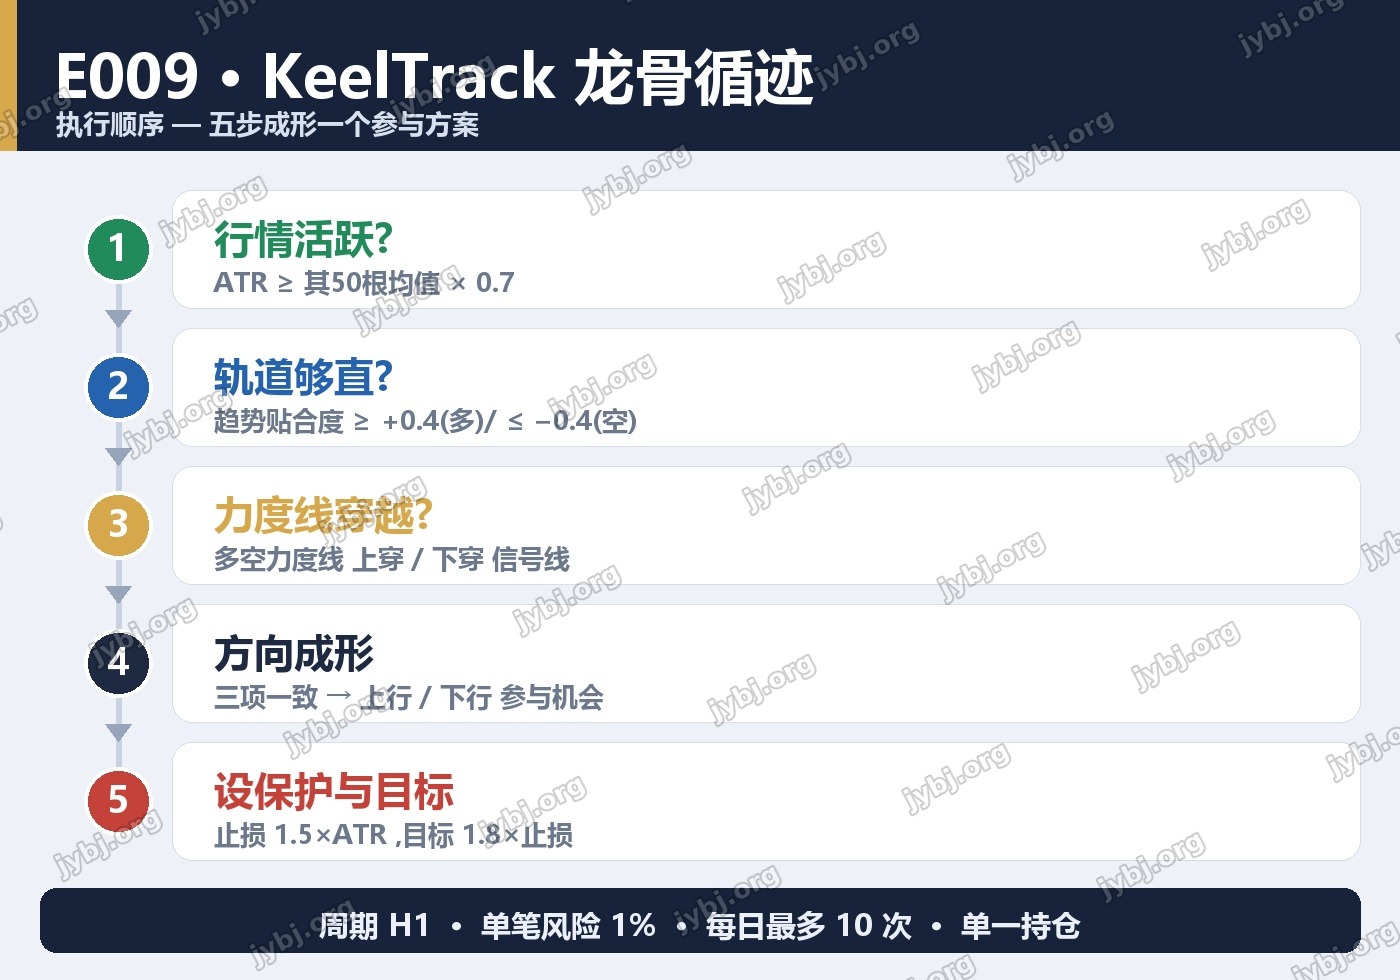
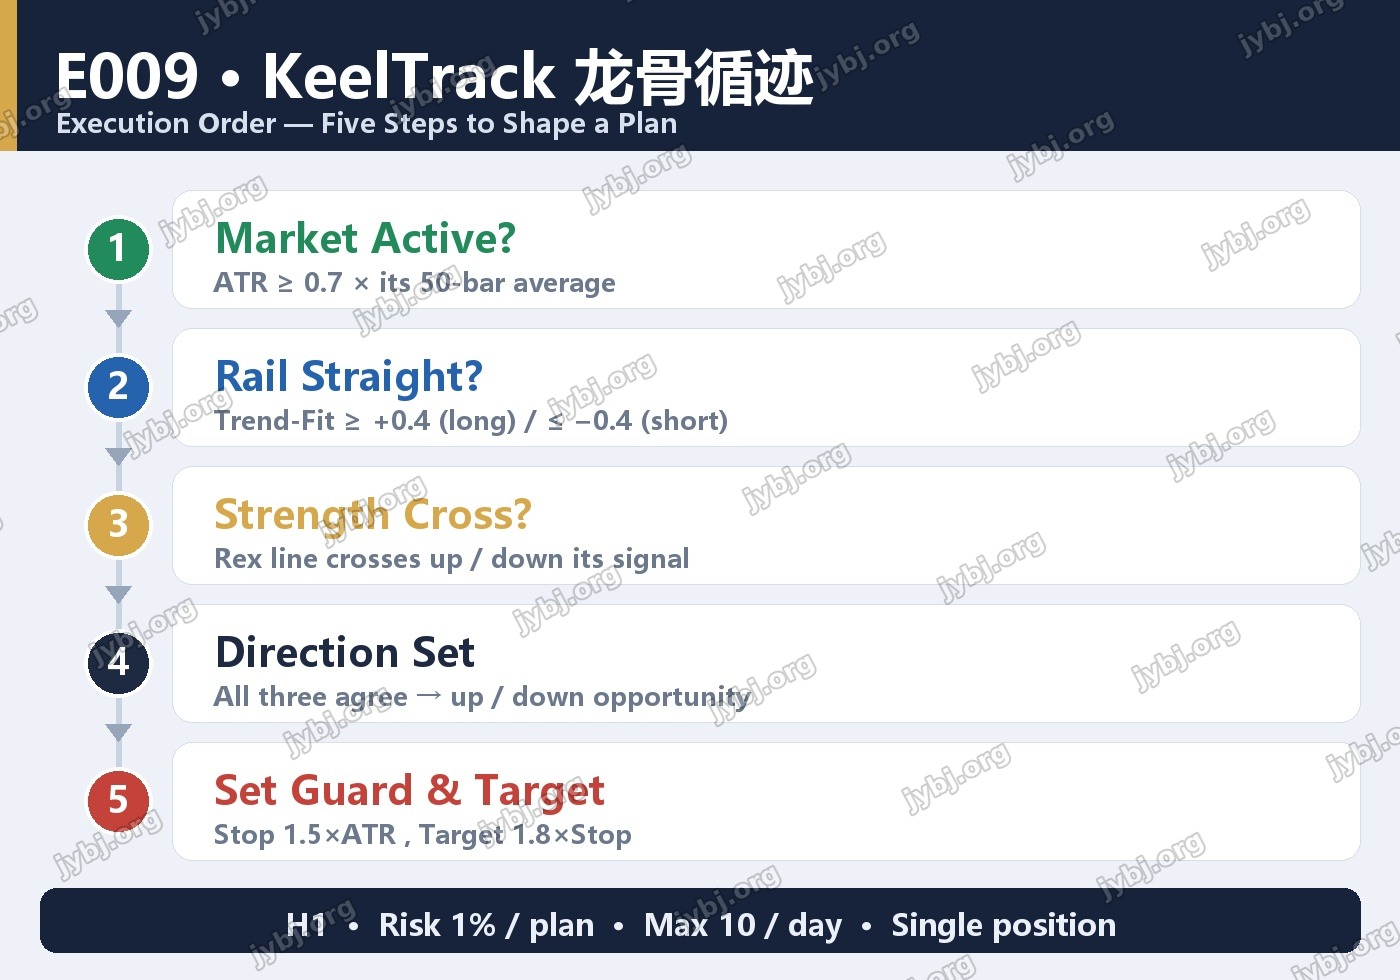
Execution Order
How a Plan Forms
| Direction | Trend-Fit (CTI) | Strength (Rex) | Activity |
|---|---|---|---|
| Upside ▲ | CTI ≥ +0.4 | cross up ↑ | ATR ≥ 0.7 × avg |
| Downside ▼ | CTI ≤ −0.4 | cross down ↓ | ATR ≥ 0.7 × avg |
Risk Shape
- Protective exit: 1.5 × ATR from entry (adapts to volatility)
- Target: 1.8 × the protective distance (1.8 reward-to-risk)
- Risk per plan: 1% · Daily cap: 10 · Magic: 20090009
[tv_analysis symbol=”XAUUSD”]
Parameters 参数设置
| Component | Setting |
|---|---|
| Trend-Fit Line (CTI) | length 20, threshold ±0.4 |
| Bull-Bear Strength (Rex) | strength 14, signal 9 |
| Activity Gate | ATR 14, floor = 0.7 × 50-bar average |
| Stop / Target | 1.5 × ATR / 1.8 × stop |
| Timeframe | H1 (works M30–H4) |
| Simulated frequency | ~1.3 signals / day (H1, defaults) |
⚠️ Study & planning framework only. This page is for learning and does not promise any outcome. Markets carry real drawdown risk. Backtest 1–2 years of H1 data yourself before any live use, and only ever participate with capital you can comfortably afford.
[tv_ticker][tv_minichart symbol=”XAUUSD”]
Source & Download
1. Place the EA file in
MQL5/Experts/ folder2. Add
https://jybj.org to WebRequest whitelist: Tools → Options → Expert Advisors → Allow WebRequest for listed URL3. One invite code = one account (non-transferable)
Ready to use · MT4 / MT5 · Parameters preconfigured 即开即用,参数已预设
Source code & compiled files: GitHub
Full documentation: Online strategy page
Live performance: View this strategy live →
Live Positions 实时持仓
[mt5_position magic=1070]
Related Trading Strategies
Want to compare more automated strategies? These related ones are worth a look:
- E008 · GyroTempo — Rhythm Flip + Baseline Gate — related strategy — compare parameters and live positions
- E007 MesaFlowPilot — Adaptive Cycle + Money Flow — related strategy — compare parameters and live positions
- E006 WaveHelm — Tide Cross + Force Confirm — related strategy — compare parameters and live positions
E009 KeelTrack Trading Strategy FAQ
Which symbols and timeframe does E009 KeelTrack suit?
E009 KeelTrack adapts to major FX and gold symbols; validate on demo first. Fine-tune for your broker’s spread and leverage, and rely on demo results before going live.
How do I download and run the E009 KeelTrack MT4/MT5 EA?
The Source & Download section provides compiled MT4/MT5 files and source. Drop it into MT5’s Experts folder, restart, and attach it to a chart — parameters are preset.
What are the risks of the E009 KeelTrack trading strategy?
No trading strategy guarantees profit; past and backtested results don’t predict the future. Run it on demo, cap per-trade and total risk, and understand the logic before trading live.
Further Reading
Risk Warning: The results shown are based on simulated or historical trading data. Past performance is not indicative of future results and does not constitute investment advice. Trading involves risk; please proceed with caution.
风险提示:本文所示为模拟/历史交易数据,过往表现不代表未来收益,不构成任何投资建议。