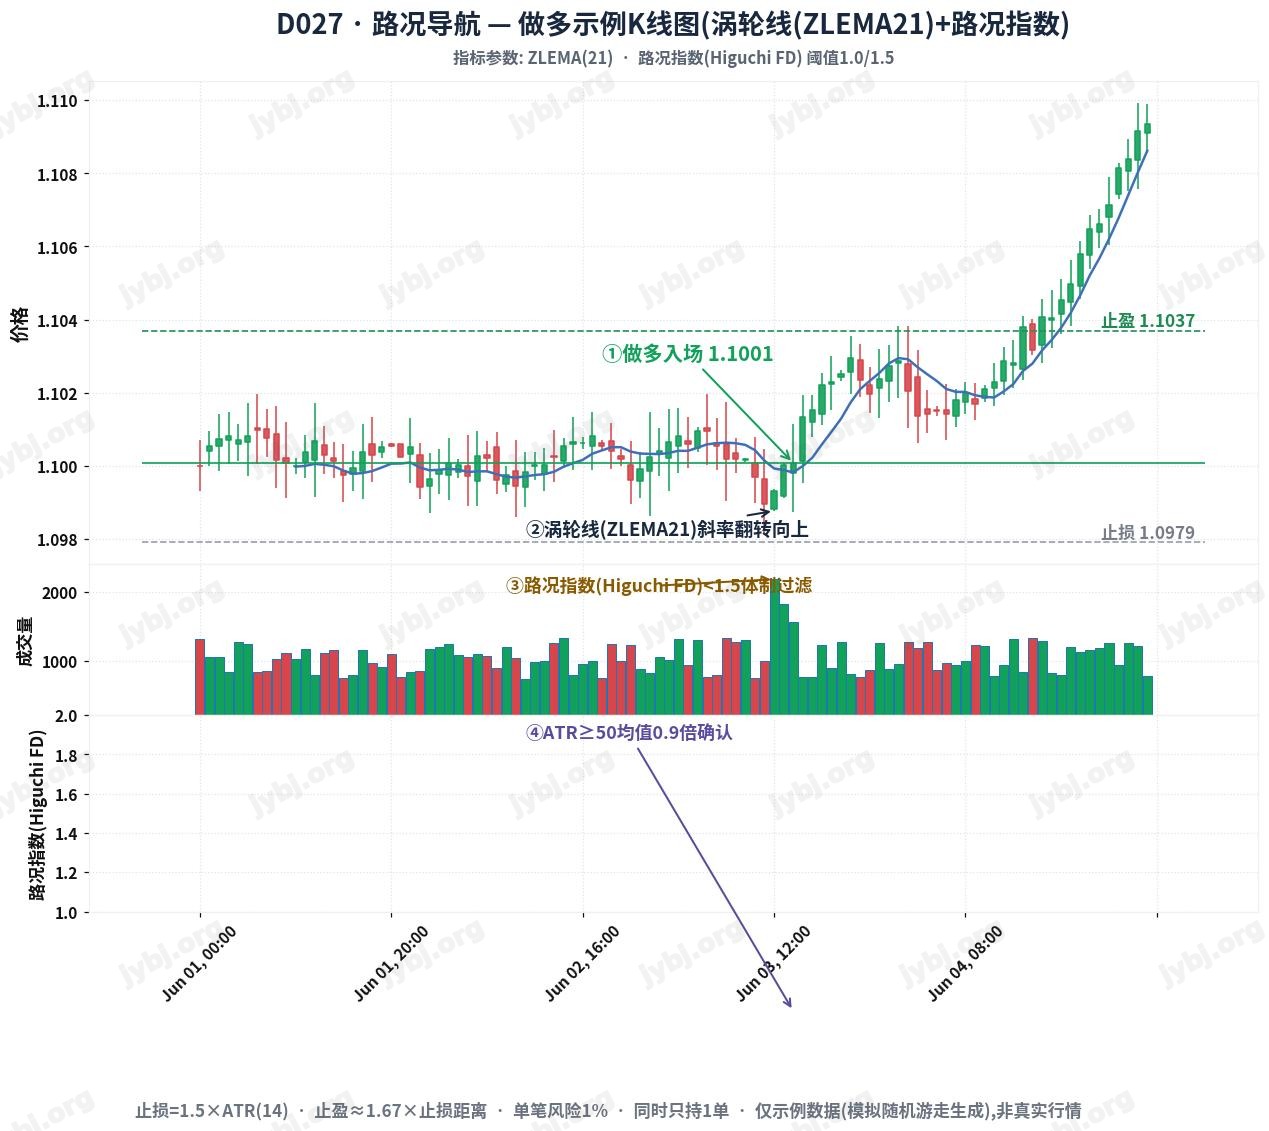
This article walks through D027, a D027 trading strategy. It covers the strategy logic, signals and parameter settings, and ships ready-to-use MT4 / MT5 EAs with source download and live position tracking so you can evaluate and deploy it fast.
Magic 1050
[tv_ticker]
Overview 策略概述
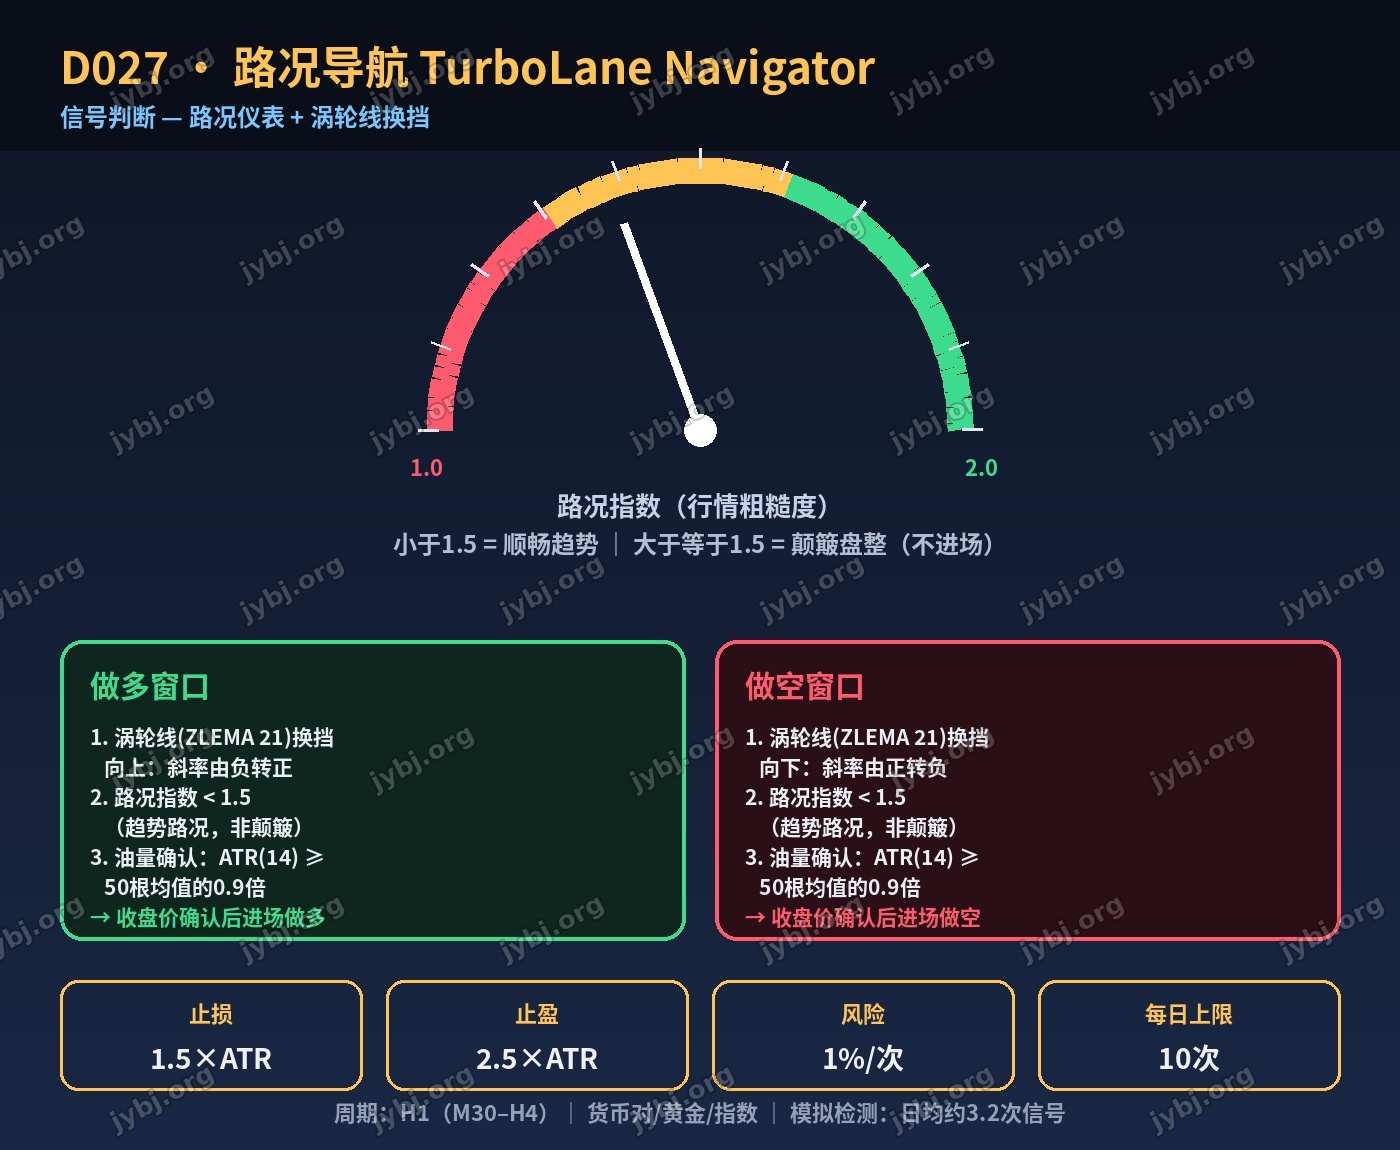
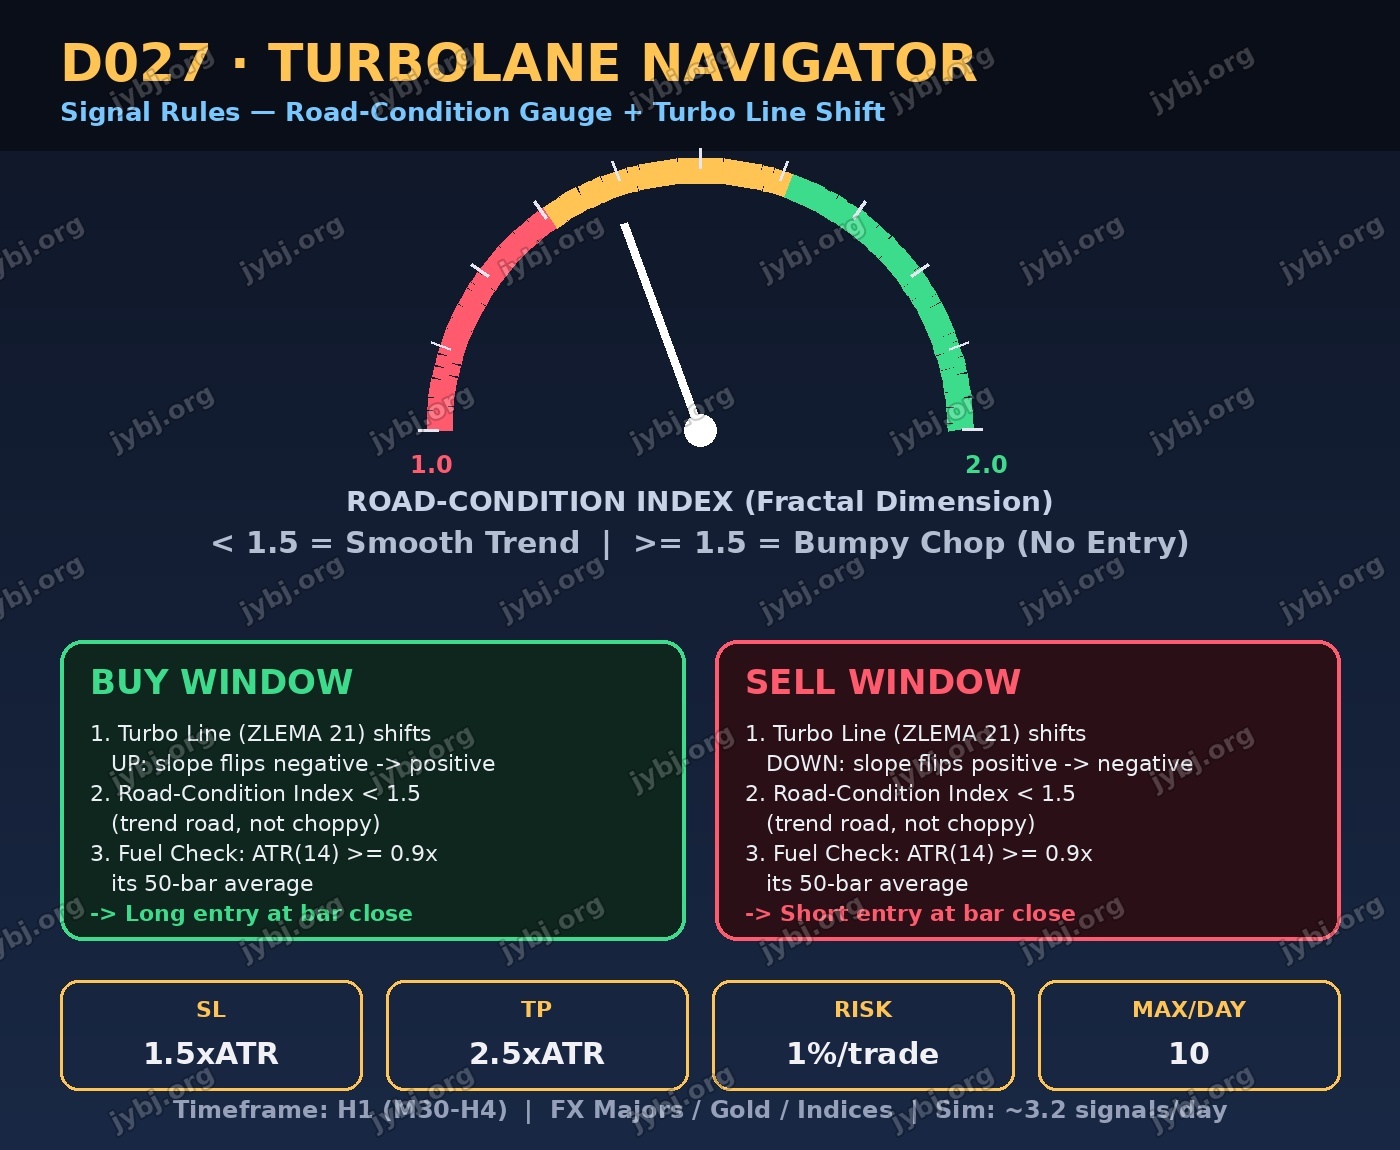
TurboLane Navigator reads the market like a dashboard instead of a chart full of oscillators.
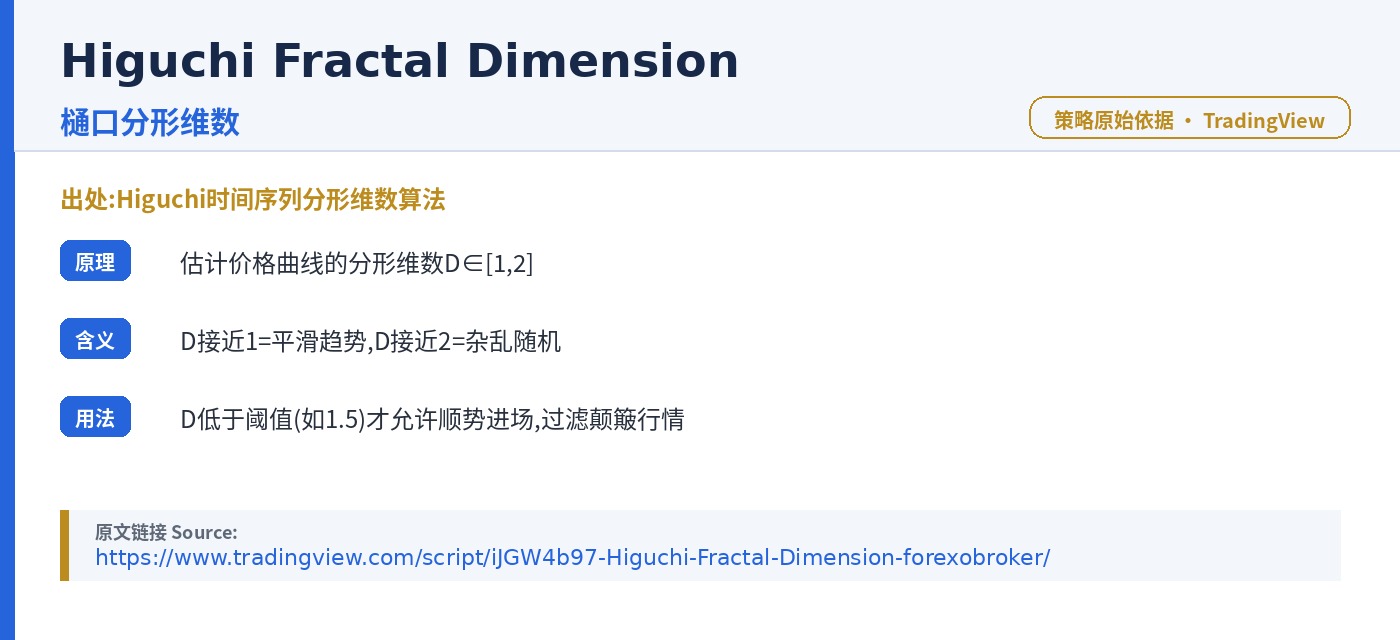
A Road-Condition Index (a Higuchi fractal-dimension estimate of the last 30 candles,
scaled 1.0–2.0) tells the system whether price action is currently smooth/trending or bumpy/choppy.
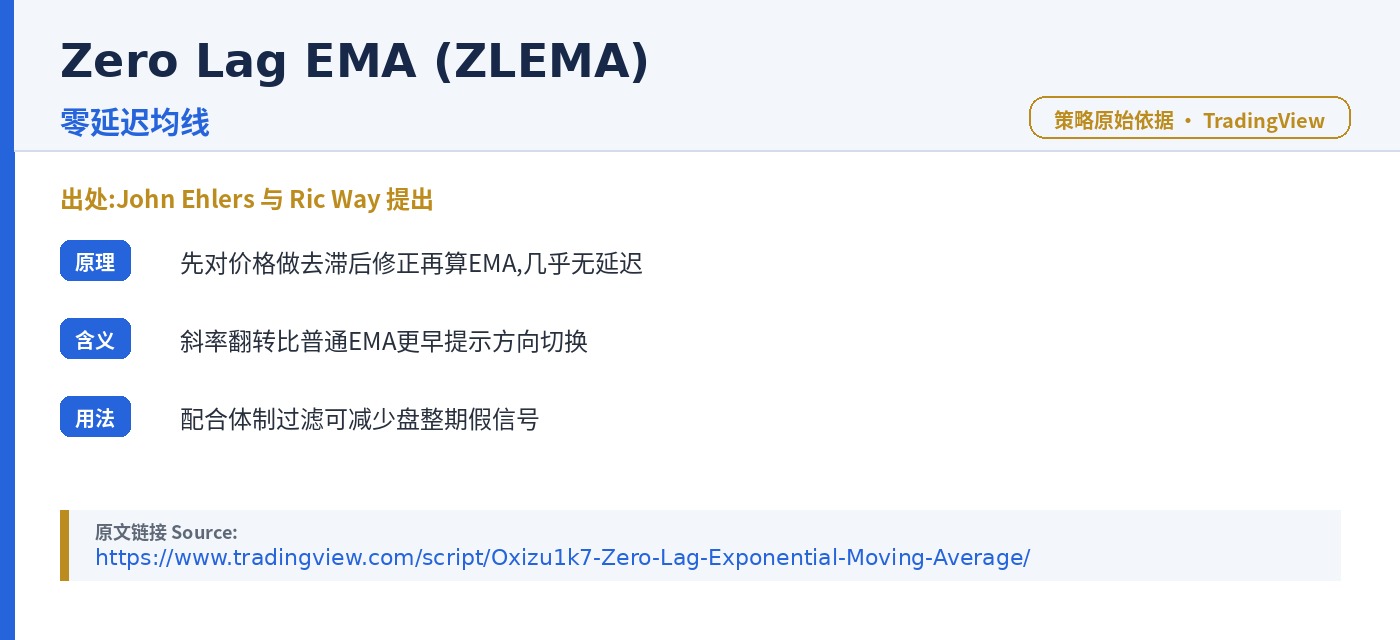
A zero-lag Turbo Line (ZLEMA) supplies direction the instant its slope changes gears.
A simple volatility “fuel check” (ATR vs. its own baseline) keeps the system out of dead,
directionless sessions. No Bollinger Bands, no RSI, no MACD — a fully mechanical, rules-based framework.
Signal Rules 信号判断
BUY Window
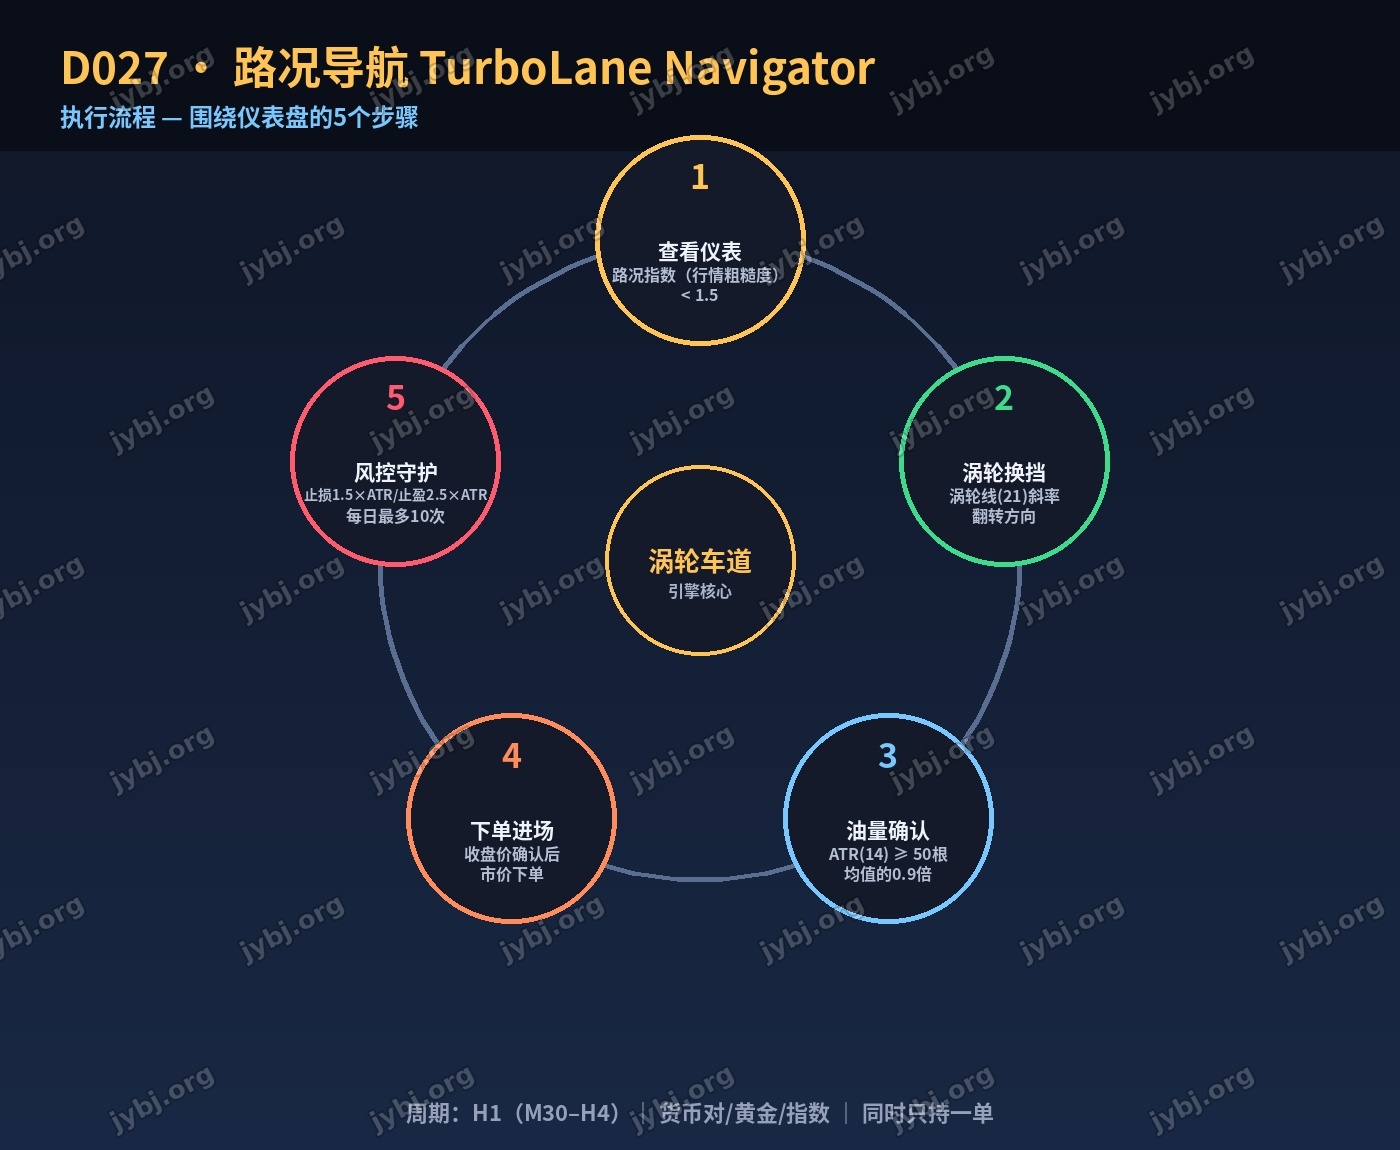
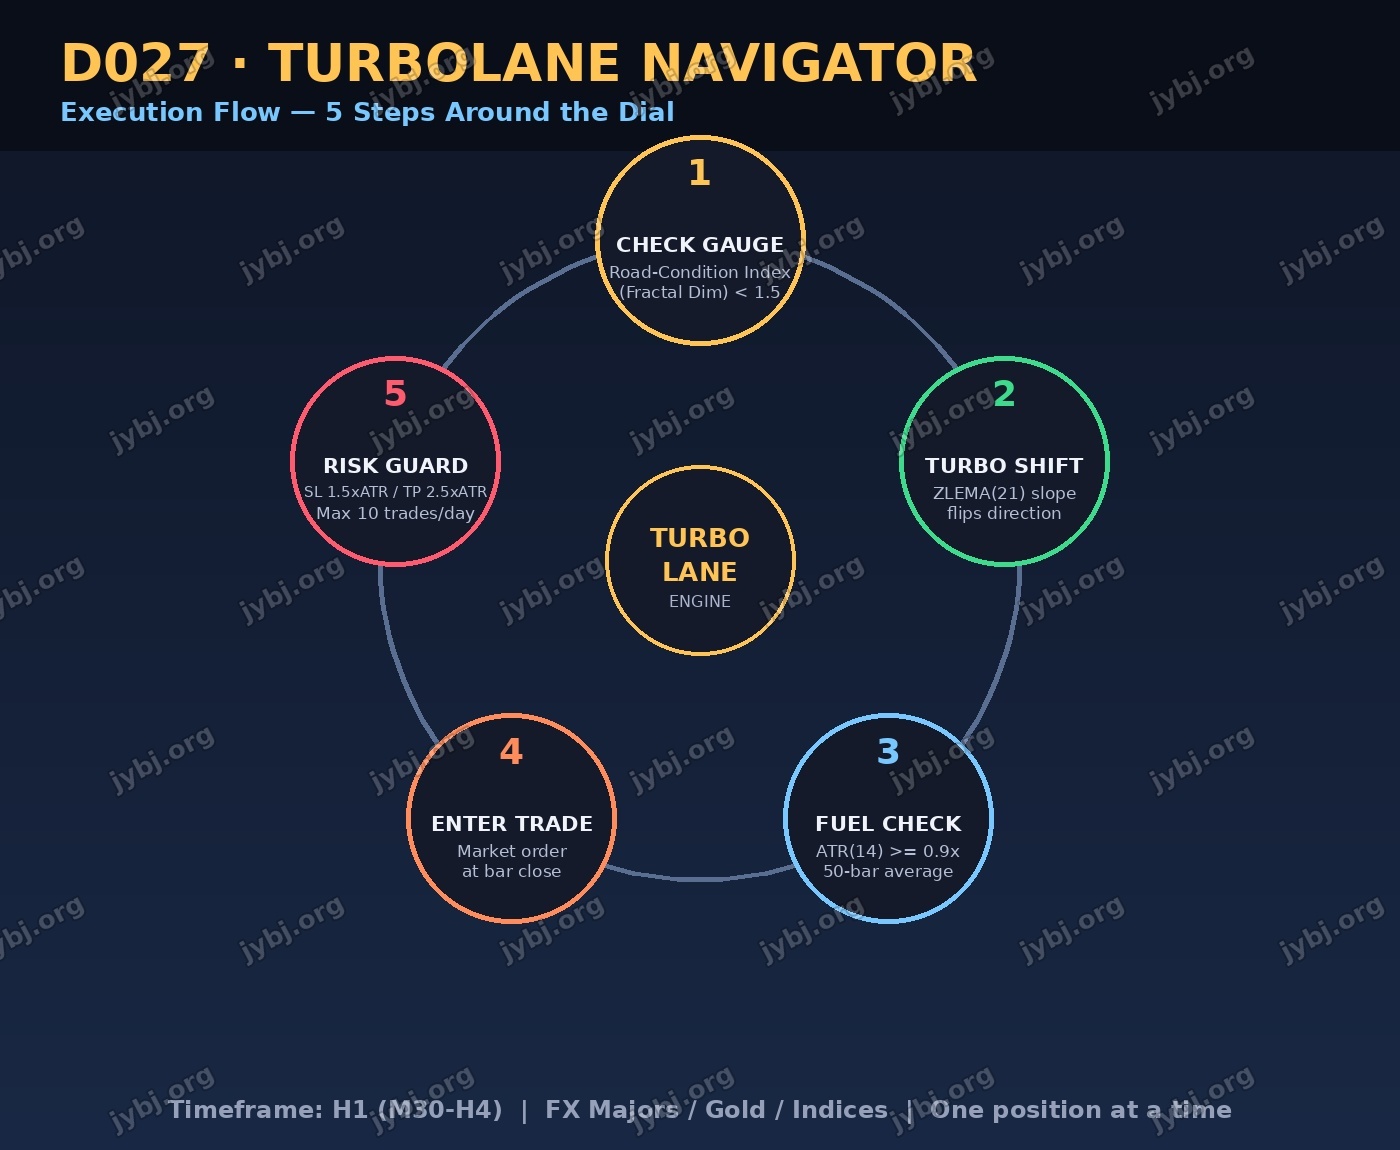
- Turbo Line (ZLEMA 21) slope flips negative → positive
- Road-Condition Index < 1.5 (smooth trend regime)
- Fuel Check: ATR(14) ≥ 0.9× its 50-bar average
- → Long entry confirmed at bar close
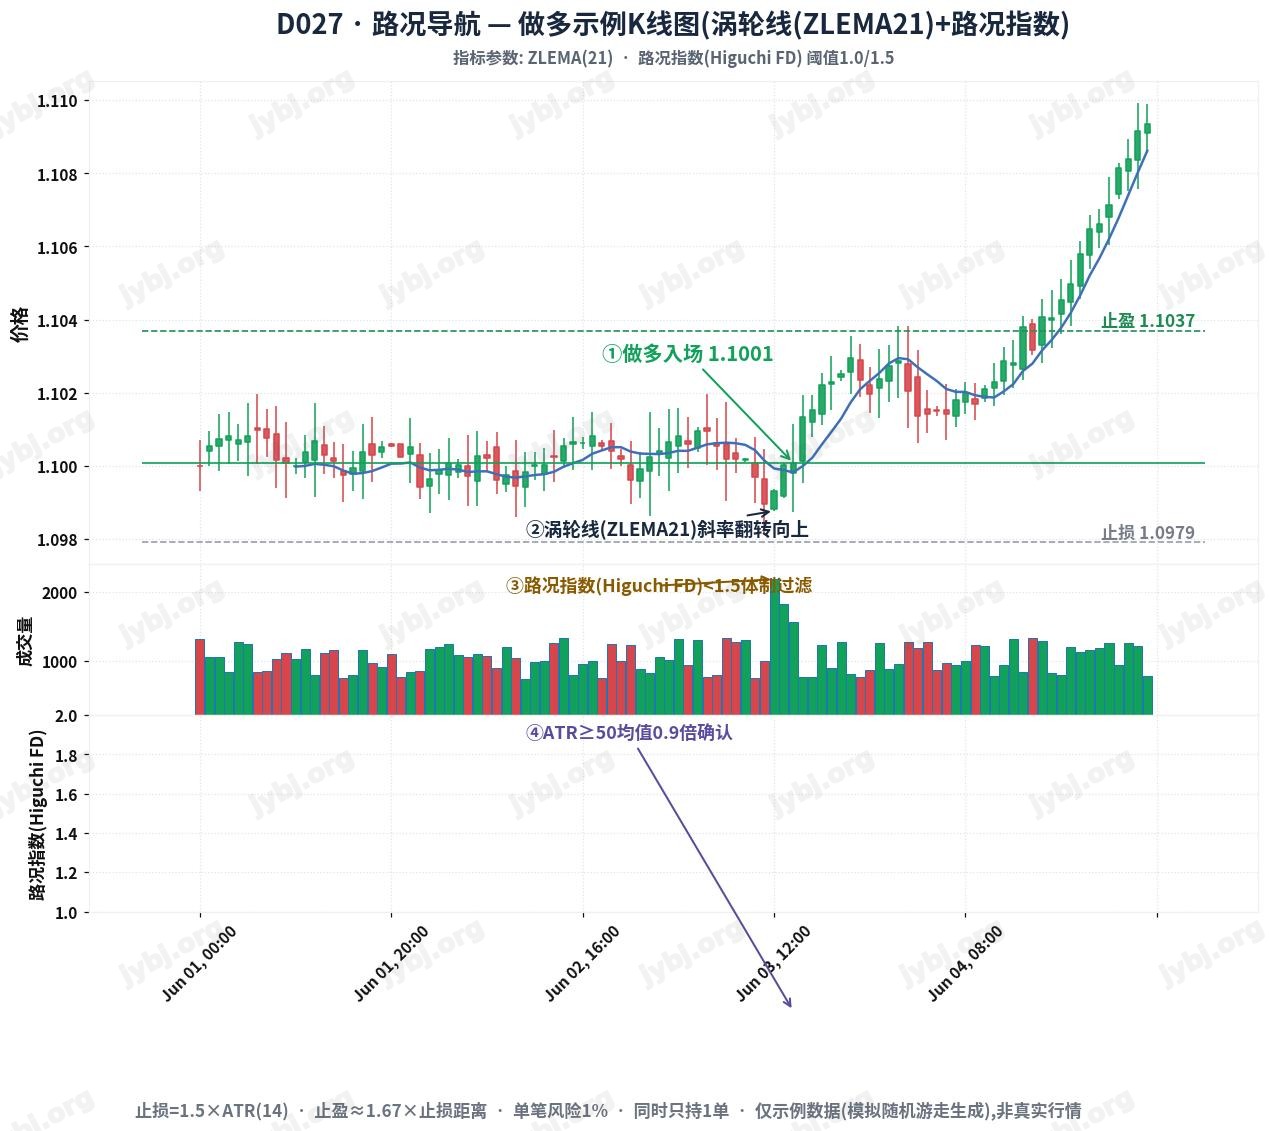
SELL Window
- Turbo Line (ZLEMA 21) slope flips positive → negative
- Road-Condition Index < 1.5 (smooth trend regime)
- Fuel Check: ATR(14) ≥ 0.9× its 50-bar average
- → Short entry confirmed at bar close
Execution Flow 执行流程
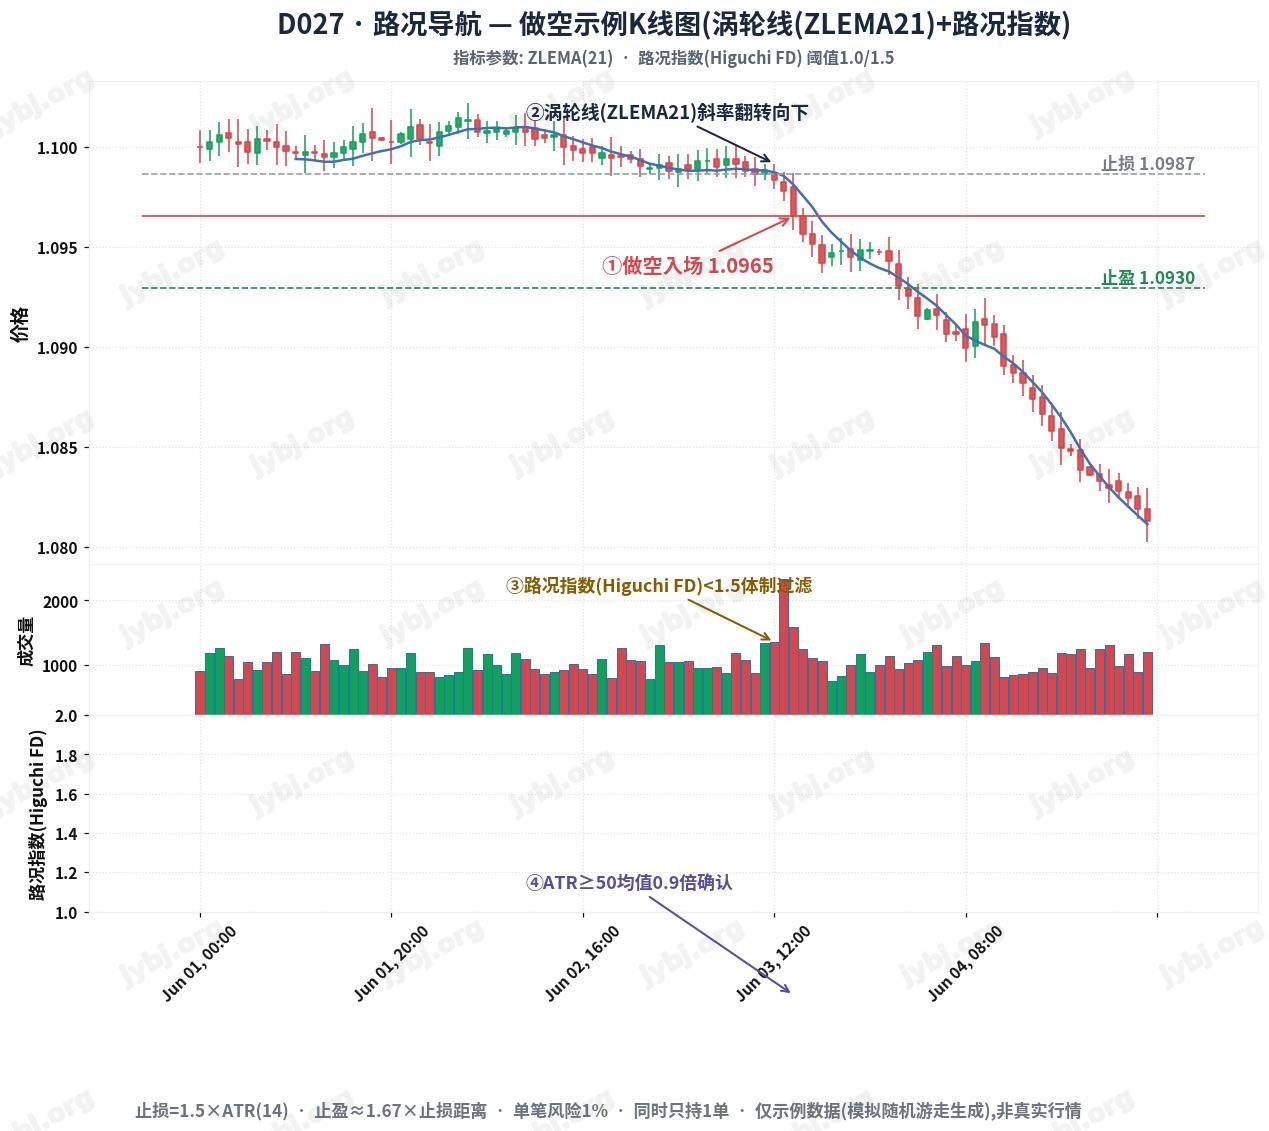
[tv_minichart symbol=”XAUUSD”]
Risk Plan & Parameters 参数设置
STOP LOSS1.5×ATR
TAKE PROFIT2.5×ATR
RISK / TRADE1%
MAX / DAY10
| Parameter | Default | Meaning |
|---|---|---|
| ZlemaPeriod | 21 | Turbo Line (zero-lag EMA) period |
| FdWindow / FdKmax | 30 / 5 | Road-Condition Index lookback window and max k |
| FdThreshold | 1.5 | Regime filter: index must be below this to trade |
| AtrPeriod / AtrAvgPeriod | 14 / 50 | ATR period and baseline averaging period |
| AtrRatio | 0.9 | Fuel check: current ATR must be ≥ ratio × baseline |
| MaxTradesPerDay | 10 | Daily entry cap, resets next day |
| NoSignalAlertDays | 3 | Watchdog alert after N days without a trade |
Simulated on synthetic H1 data (alternating trend/choppy regimes):
average ~3.2 signals per day — within the 1–10/day target range.
Risk Disclosure: This page describes a rules-based trading framework for research
and educational purposes only. It is not investment advice and does not guarantee any result. Historical
or simulated performance is not indicative of future outcomes. Trading leveraged instruments carries a
high level of risk and may not be suitable for all investors. Please test thoroughly on a demo account
and never risk capital you cannot afford to lose.
[tv_analysis symbol=”XAUUSD”][tv_minichart symbol=”EURUSD”]
Source & Download
1. Place the EA file in
MQL5/Experts/ folder2. Add
https://jybj.org to WebRequest whitelist: Tools → Options → Expert Advisors → Allow WebRequest for listed URL3. One invite code = one account (non-transferable)
Ready to use · MT4 / MT5 · Parameters preconfigured 即开即用,参数已预设
Source code & compiled files: GitHub
Full documentation: Online strategy page
Live performance: View this strategy live →
Live Positions 实时持仓
[mt5_position magic=1050]
Related Trading Strategies
Want to compare more automated strategies? These related ones are worth a look:
- D026 · DaybreakSurge — Strategy Overview — related strategy — compare parameters and live positions
- D025 · TrendVigor Drive — Strategy Overview — related strategy — compare parameters and live positions
- D024 KagiClarity Flow — Kagi Reversal + Regression Clarity Trading System — related strategy — compare parameters and live positions
D027 Trading Strategy FAQ
Which symbols and timeframe does D027 suit?
D027 adapts to major FX and gold symbols; validate on demo first. Fine-tune for your broker’s spread and leverage, and rely on demo results before going live.
How do I download and run the D027 MT4/MT5 EA?
The Source & Download section provides compiled MT4/MT5 files and source. Drop it into MT5’s Experts folder, restart, and attach it to a chart — parameters are preset.
What are the risks of the D027 trading strategy?
No trading strategy guarantees profit; past and backtested results don’t predict the future. Run it on demo, cap per-trade and total risk, and understand the logic before trading live.
Further Reading
Risk Warning: The results shown are based on simulated or historical trading data. Past performance is not indicative of future results and does not constitute investment advice. Trading involves risk; please proceed with caution.
风险提示:本文所示为模拟/历史交易数据,过往表现不代表未来收益,不构成任何投资建议。