This article walks through Nebula Reversion, a Nebula Reversion trading strategy. It covers the strategy logic, signals and parameter settings, and ships ready-to-use MT4 / MT5 EAs with source download and live position tracking so you can evaluate and deploy it fast.
Magic 1000026
[tv_ticker]
A Smarter Way to Trade Mean Reversion
Most reversion strategies fail because they ignore market regime. Nebula Reversion only activates when conditions are statistically favorable for mean reversion — low trend strength combined with extreme price and momentum readings.
Regime-Aware
Uses ADX to confirm the market is not trending strongly. This dramatically improves the quality of reversion signals.
Built-in Risk Control
Dynamic stop loss via ATR, fixed 1% account risk per trade, and clear take-profit rules. No martingale or grid.
Fully Executable
Ready-to-deploy Expert Advisors for MetaTrader 4 and MetaTrader 5 with professional parameter structure and comments.
HOW IT WORKS
Core Logic & Rules 核心逻辑
The strategy combines volatility extremes, momentum confirmation, and a trend-strength filter for high-quality setups.
LONG SETUP
Regime Filter: ADX(14) < 25 — confirms low trend strength
Price Condition: Price touches or closes below lower Bollinger Band (20, 2)
Momentum Confirmation: RSI(14) < 30 (oversold)
Entry → Protection → Target
Buy at market • SL = Entry − (ATR × 1.5) • TP = Middle Bollinger Band or 1:2 RR
SHORT SETUP
Regime Filter: ADX(14) < 25 — confirms low trend strength
Price Condition: Price touches or closes above upper Bollinger Band (20, 2)
Momentum Confirmation: RSI(14) > 70 (overbought)
Entry → Protection → Target
Sell at market • SL = Entry + (ATR × 1.5) • TP = Middle Bollinger Band or 1:2 RR
CONFIGURATION
Strategy Parameters 参数设置
All parameters are fully customizable in the Expert Advisor. Recommended defaults shown below.
| Parameter | Default Value | Description |
|---|---|---|
| Bollinger Bands Period | 20 | Period for volatility bands |
| Bollinger Bands Deviation | 2.0 | Standard deviation multiplier |
| RSI Period | 14 | Momentum oscillator period |
| RSI Oversold / Overbought | 30 / 70 | Extreme levels for signal confirmation |
| ADX Period & Threshold | 14 / 25 | Trend strength filter — only trade when ADX < 25 |
| ATR Period & SL Multiplier | 14 / 1.5 | Volatility-based dynamic stop loss |
| Risk per Participation | 1.0% | Maximum account risk per trade |
| Take Profit Rule | Middle BB or 1:2 RR | Primary target = middle band; alternative fixed RR |
SIGNAL & EXECUTION[tv_calendar]
Visual Guides
Signal Judgment
Long Example
Included in package
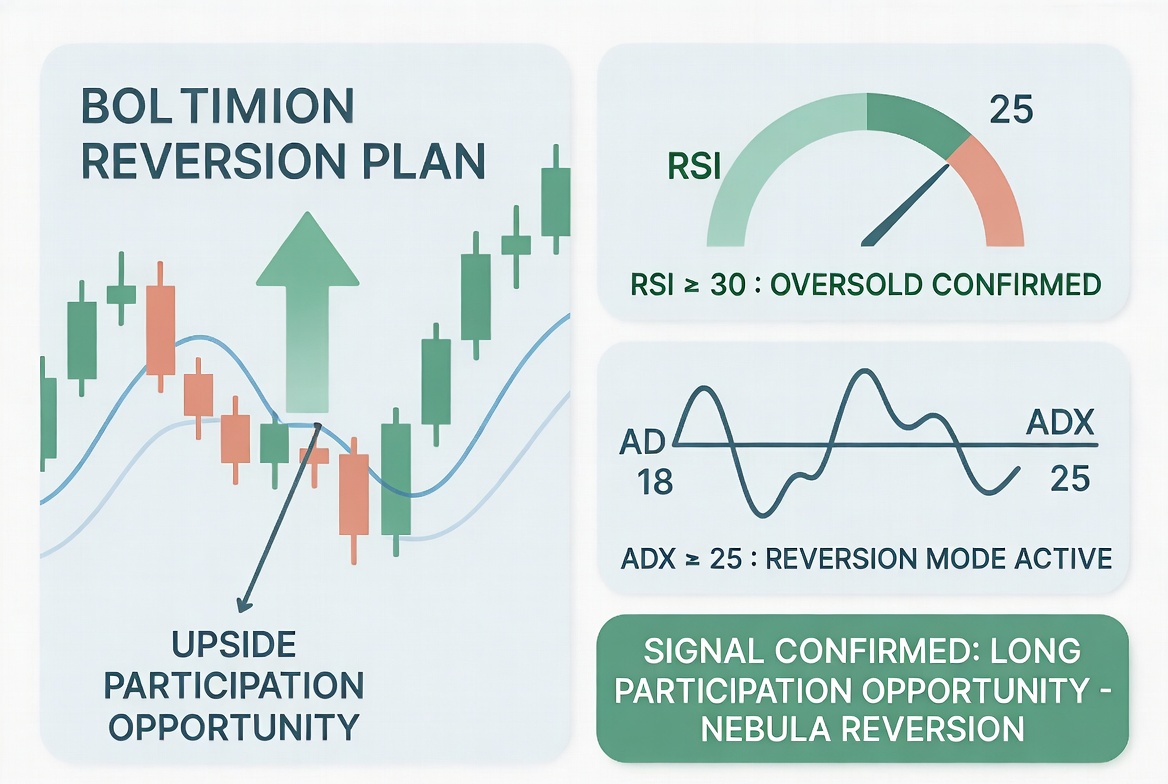
Nebula Reversion Signal Detection
Chart + RSI + ADX Dashboard
See HGAcI.jpg in package
Clear visual showing price at lower Bollinger Band, RSI < 30, ADX < 25 confirming long participation opportunity.
Execution Sequence
Included in package
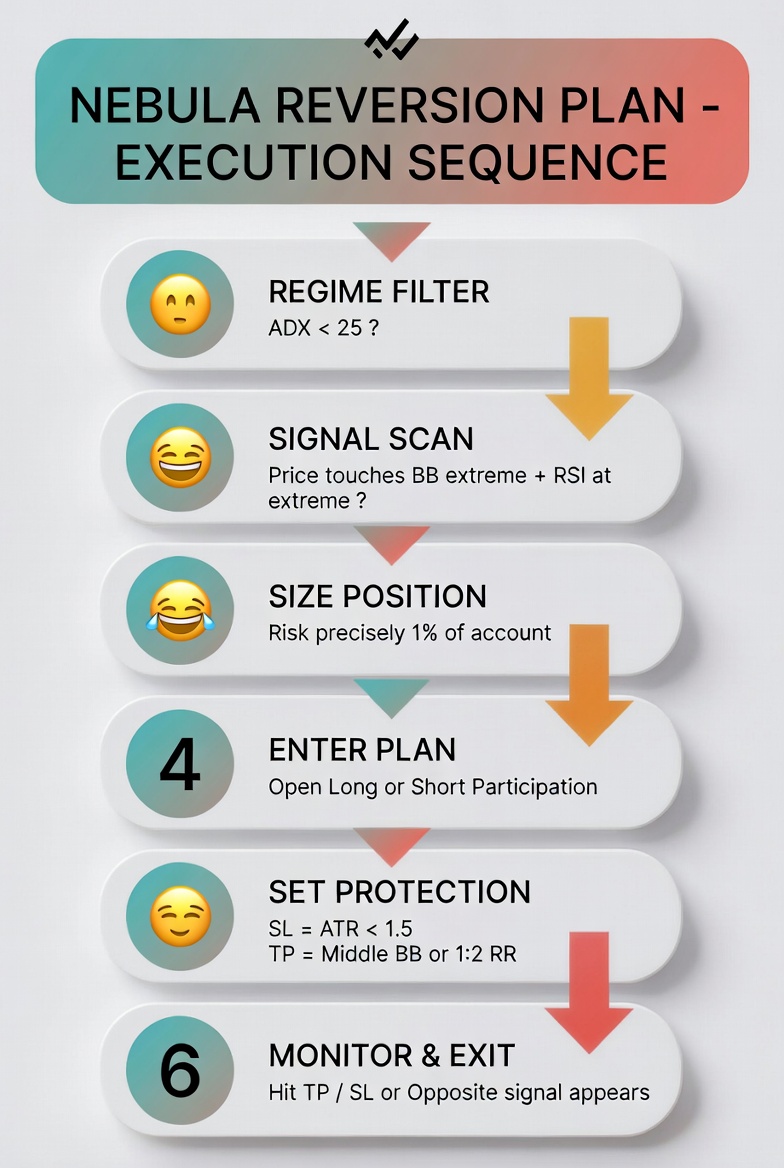
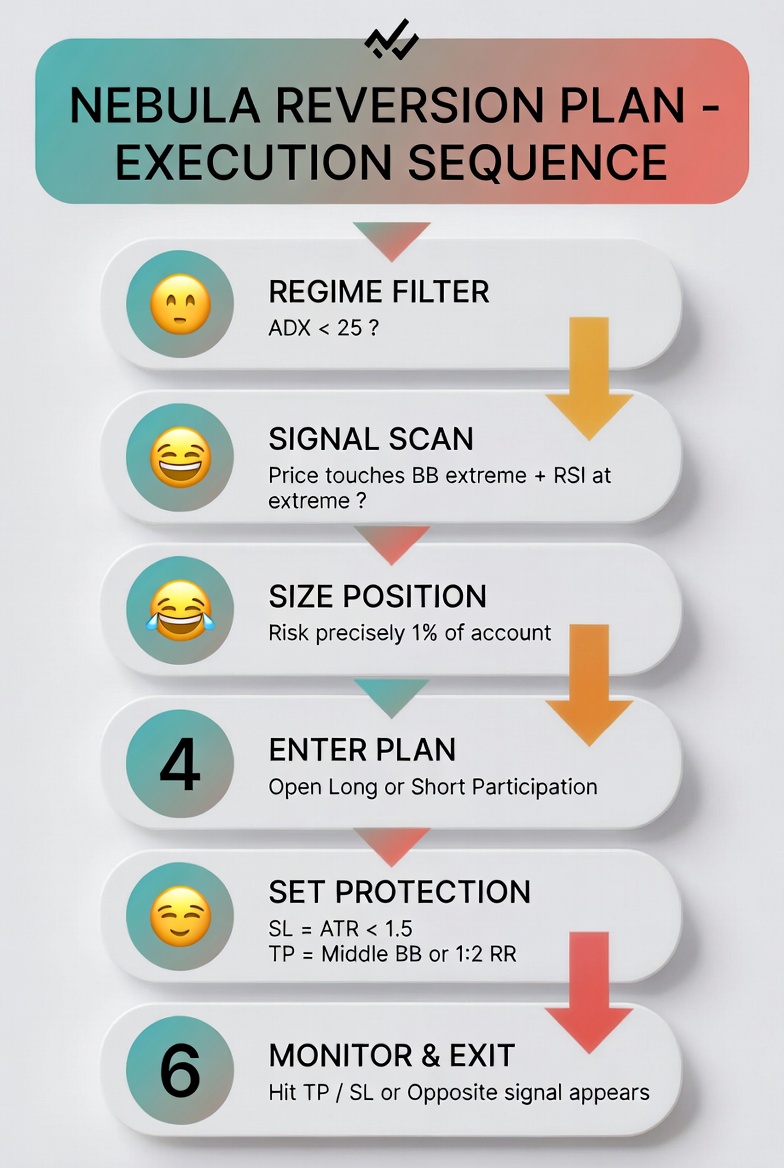
6-Step Professional Flowchart
Regime → Signal → Size → Enter → Protect → Monitor
See yu7HR.jpg in package
Simple, large-text flowchart designed for quick understanding and consistent execution.
ILLUSTRATIVE RESULTS
Sample Backtest Metrics
For illustration only • Different markets will vary
Win Rate
58.4%
Profit Factor
1.72
Max Drawdown
-11.8%
Avg R:R Achieved
1.65
Illustrative equity curve — not a guarantee of future performance
Ready to implement Nebula Reversion? 运行说明
Download the complete professional package including MT4 & MT5 Expert Advisors, beautiful visual guides, and documentation.
Download MT4 EA (.mq4)
Download MT5 EA (.mq5)
Files are also included in the full package zip you received.
Important Risk Disclosure
Trading foreign exchange, futures, stocks, and other leveraged products carries a high level of risk and may not be suitable for all investors. Past performance is not indicative of future results. The high degree of leverage can work against you as well as for you. Before deciding to trade, you should carefully consider your investment objectives, level of experience, and risk appetite. There is a possibility that you could sustain a loss of some or all of your initial investment. You should be aware of all the risks associated with trading, and seek advice from an independent financial advisor if you have any doubts.
This material is for educational and informational purposes only and does not constitute investment advice or a recommendation to buy or sell any financial instrument.
[tv_minichart symbol=”XAUUSD”][mt5_calc_position]
Source & Download
1. Place the EA file in
MQL5/Experts/ folder2. Add
https://jybj.org to WebRequest whitelist: Tools → Options → Expert Advisors → Allow WebRequest for listed URL3. One invite code = one account (non-transferable)
Ready to use · MT4 / MT5 · Parameters preconfigured 即开即用,参数已预设
📥 Download C029Nebula_Reversion_EA_MQL4_merged.ex4 (.ex4)
📥 Download C029Nebula_Reversion_EA_MQL5_merged.ex5 (.ex5)
Source code & compiled files: GitHub
Full documentation: Online strategy page
Live performance: View this strategy live →
Live Positions 实时持仓
[mt5_position magic=1000026]
Related Trading Strategies
Want to compare more automated strategies? These related ones are worth a look:
- Liquidity Sweep Reversal Strategy | Professional Quantitative Trading Plan — related strategy — compare parameters and live positions
- LuminaPulse Reversion Scheme | Professional Quantitative Participation Plan — related strategy — compare parameters and live positions
- Squeeze Momentum Ignition System | Professional Quantitative Trading Strategy — related strategy — compare parameters and live positions
Nebula Reversion Trading Strategy FAQ
Which symbols and timeframe does Nebula Reversion suit?
Nebula Reversion adapts to major FX and gold symbols; validate on demo first. Fine-tune for your broker’s spread and leverage, and rely on demo results before going live.
How do I download and run the Nebula Reversion MT4/MT5 EA?
The Source & Download section provides compiled MT4/MT5 files and source. Drop it into MT5’s Experts folder, restart, and attach it to a chart — parameters are preset.
What are the risks of the Nebula Reversion trading strategy?
No trading strategy guarantees profit; past and backtested results don’t predict the future. Run it on demo, cap per-trade and total risk, and understand the logic before trading live.
Further Reading
Risk Warning: The results shown are based on simulated or historical trading data. Past performance is not indicative of future results and does not constitute investment advice. Trading involves risk; please proceed with caution.
风险提示:本文所示为模拟/历史交易数据,过往表现不代表未来收益,不构成任何投资建议。