This article walks through D023 FrameCascade, a D023 FrameCascade trading strategy. It covers the strategy logic, signals and parameter settings, and ships ready-to-use MT4 / MT5 EAs with source download and live position tracking so you can evaluate and deploy it fast.
Magic 1046
[tv_ticker]
Why Cross-Timeframe FRAMA?
Most single-timeframe crossovers fire constantly — including straight into the teeth of a bigger opposing
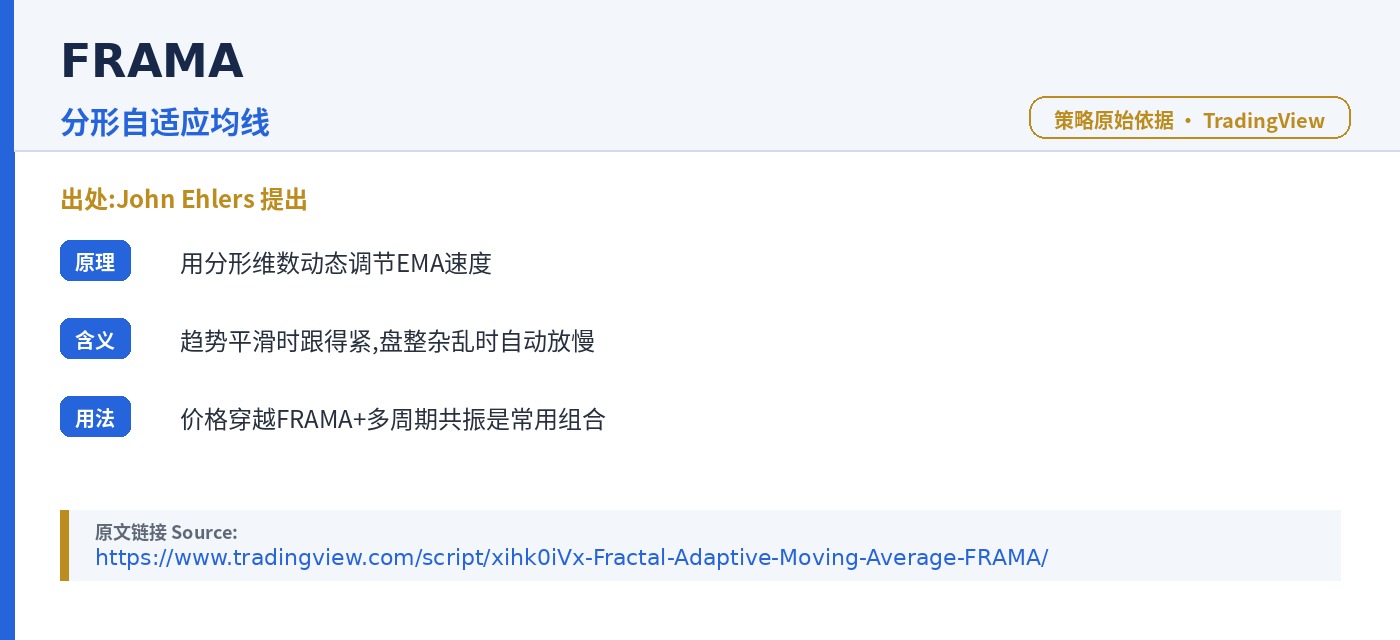
trend. FRAMA (Fractal Adaptive Moving Average) already adapts its own speed to market roughness: it hugs price
tightly in strong trends and flattens out in choppy ranges. FrameCascade takes this one step further by
requiring the same FRAMA line on a higher timeframe (H4) to already be sloping in the trade’s direction —
a simple, mechanical way to avoid fighting the dominant trend.
alpha = exp(-4.6 × (D − 1)), D = fractal dimension of the lookback window, FRAMA = alpha·Price + (1−alpha)·FRAMA[prev]
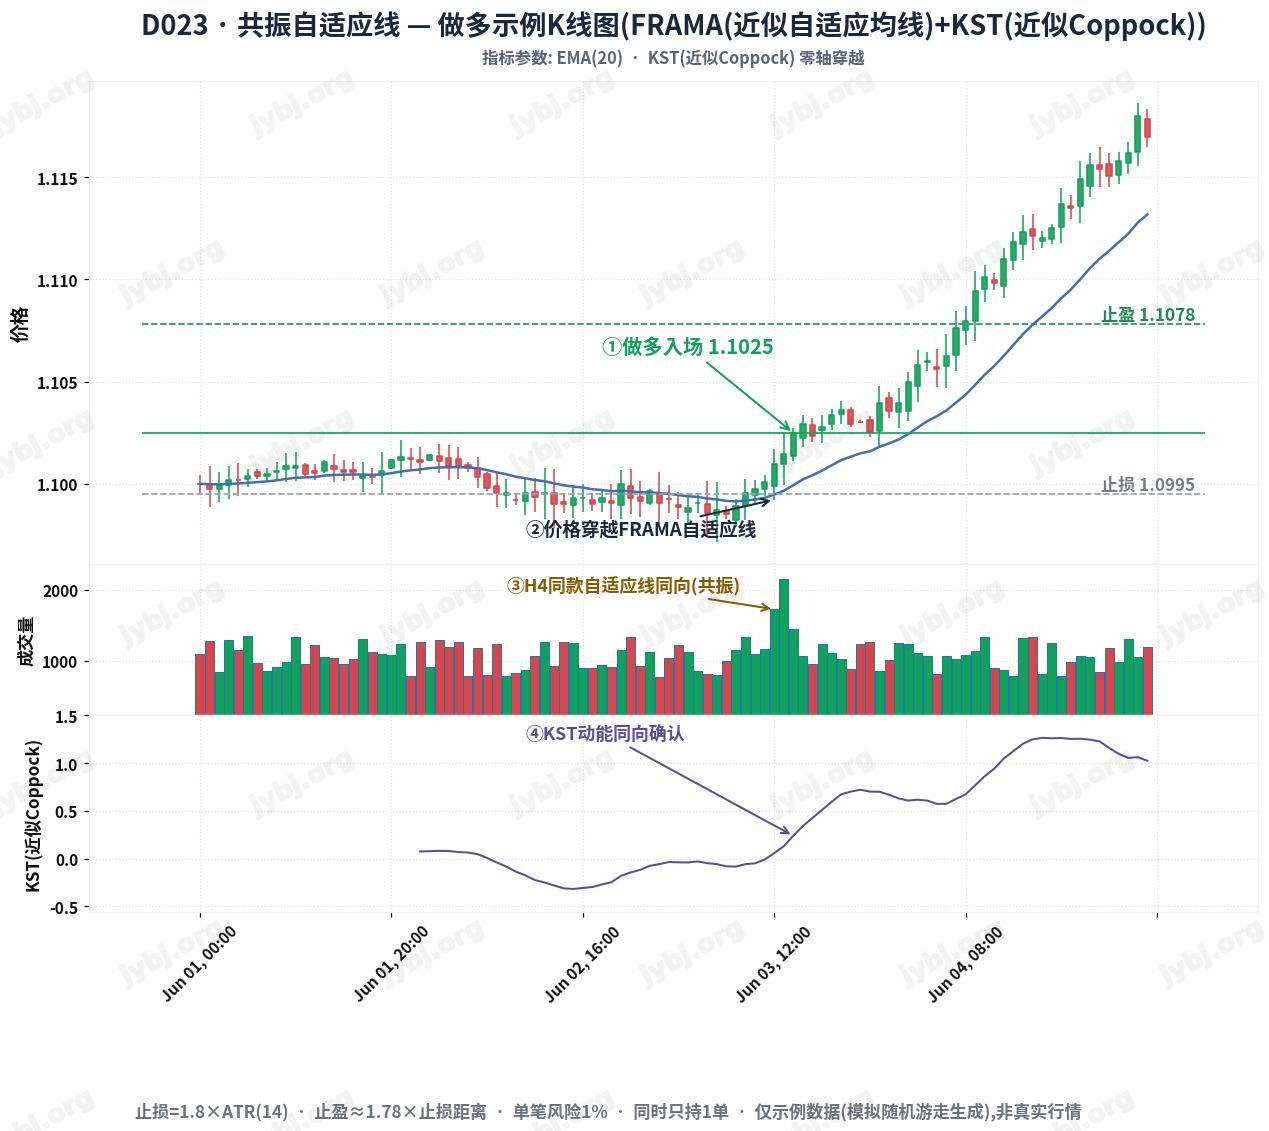
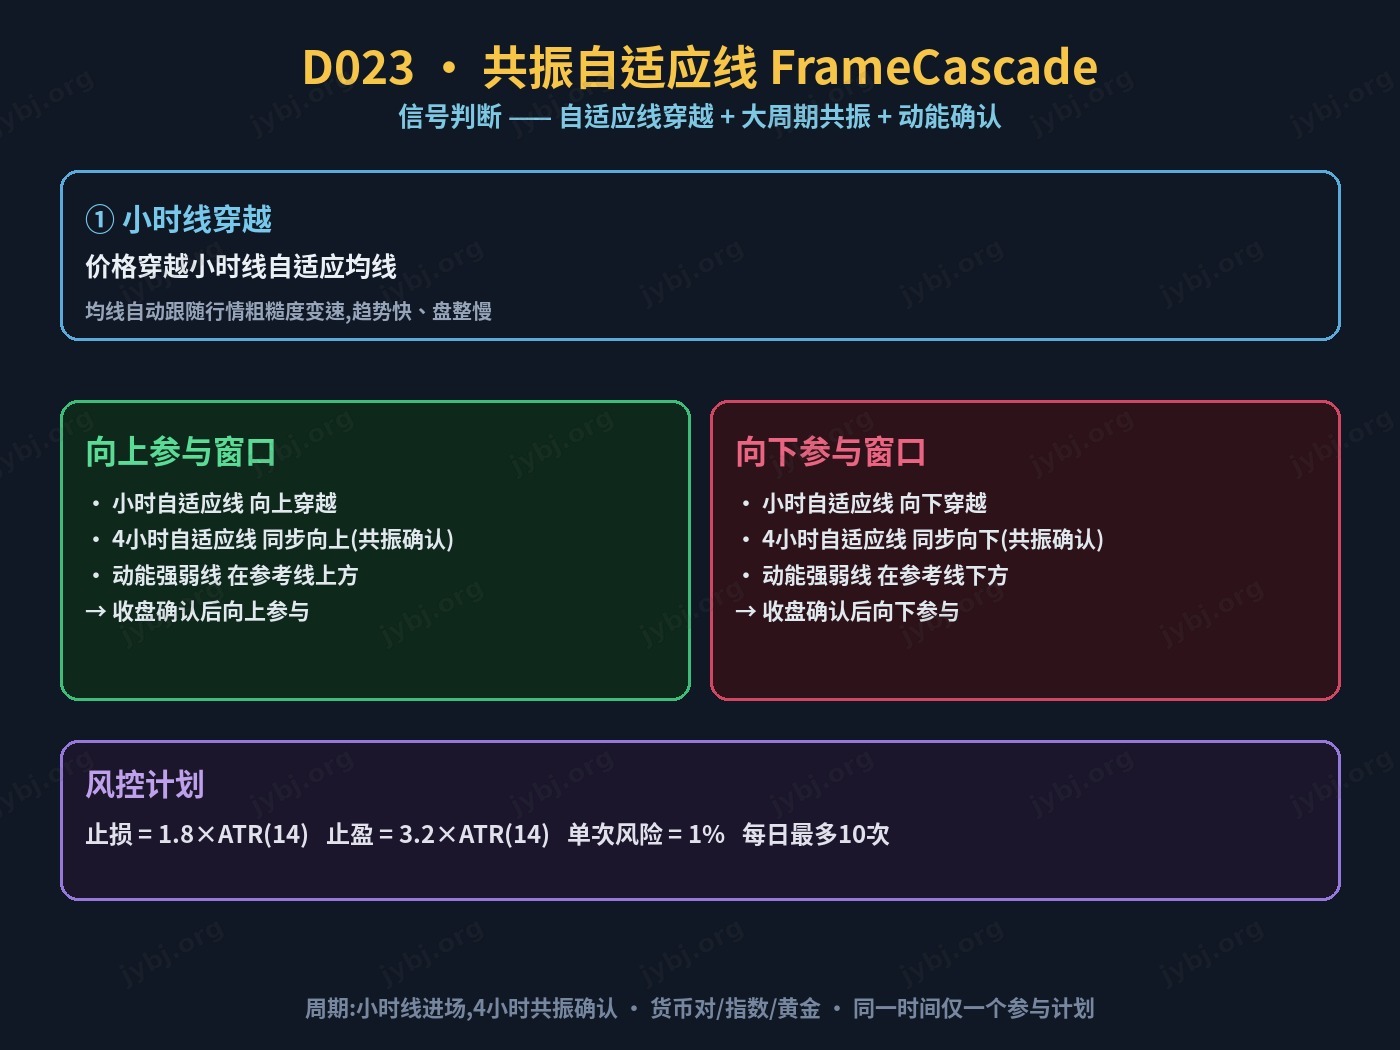
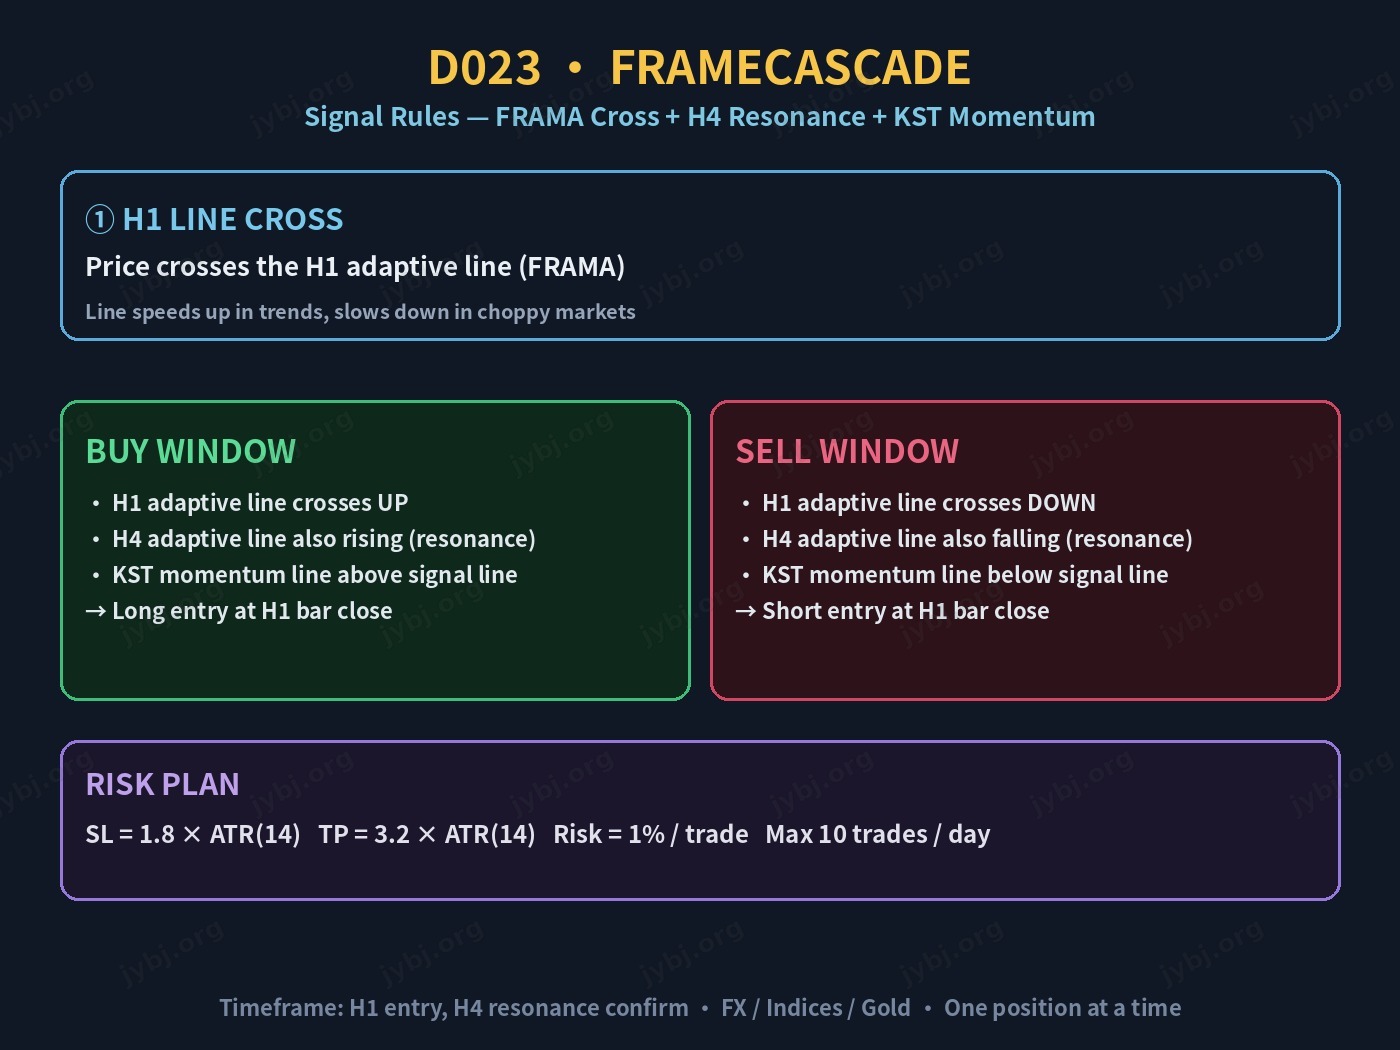
Only when the H1 line is crossed and the H4 line agrees and the KST momentum line confirms
does FrameCascade open a position.
Entry Rules 入场条件
LONG Setup
- H1 close crosses above FRAMA(16) on the H1 chart
- H4 FRAMA(16) is higher than its previous H4 value (rising — resonance confirm)
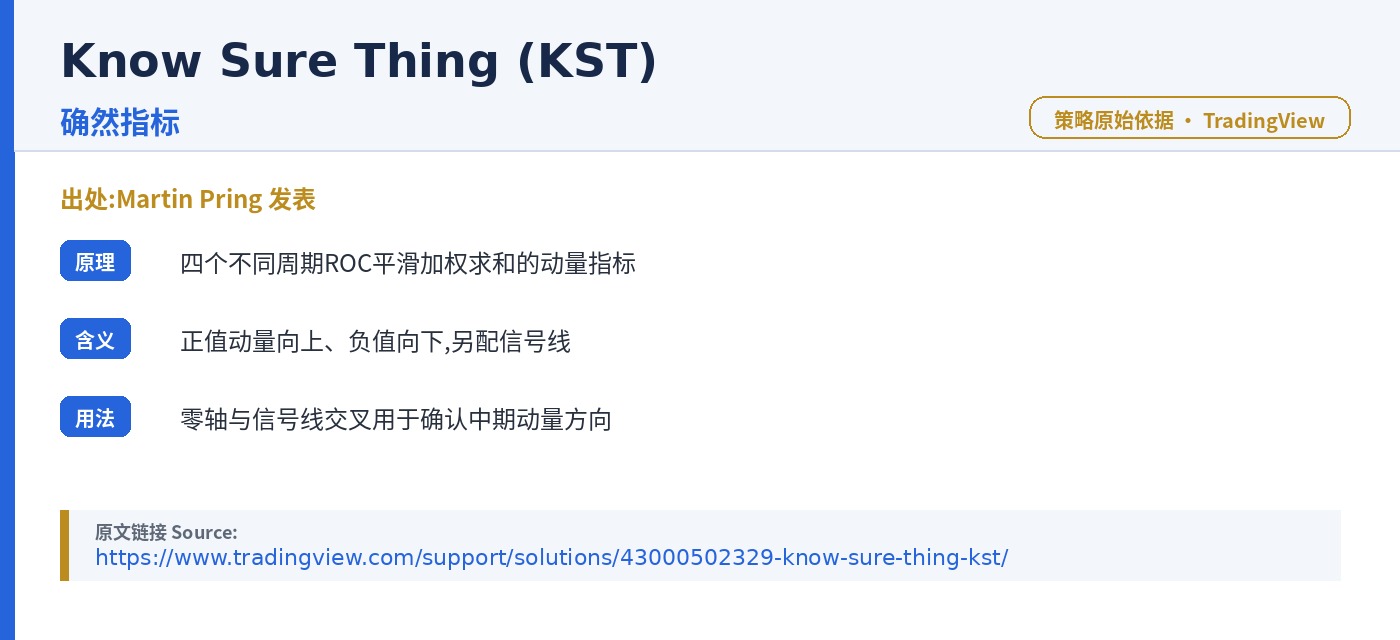
- KST momentum line is above its 9-period signal line
- Enter long at H1 bar close
SHORT Setup
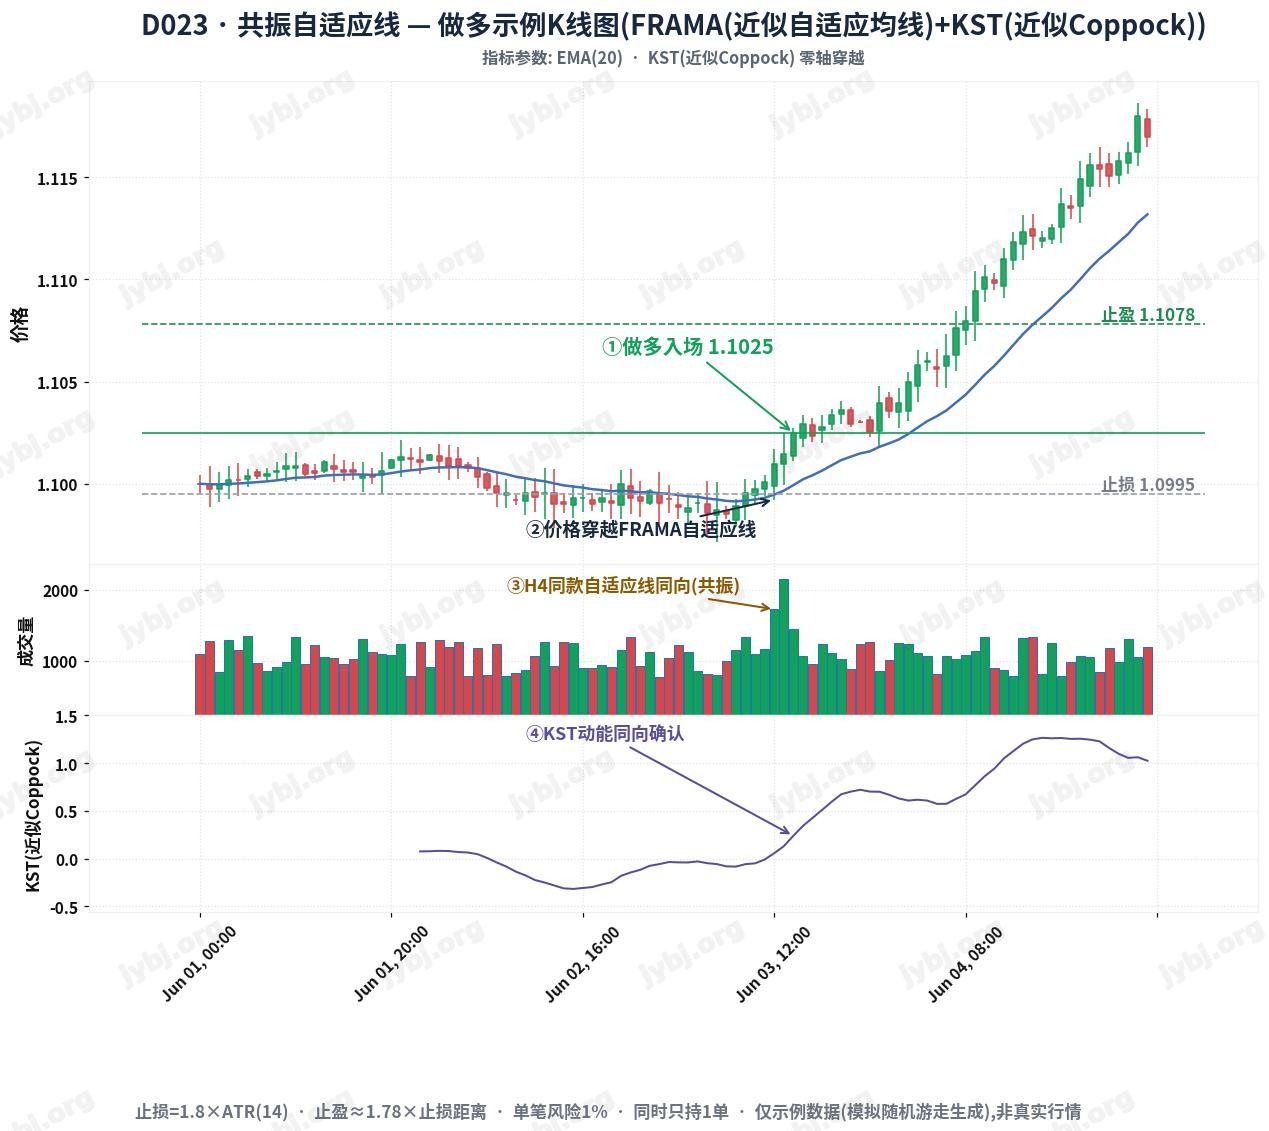
- H1 close crosses below FRAMA(16) on the H1 chart
- H4 FRAMA(16) is lower than its previous H4 value (falling — resonance confirm)
- KST momentum line is below its 9-period signal line
- Enter short at H1 bar close
Exit & Risk Management 出场条件
Fixed, volatility-adaptive risk plan
- Stop Loss: entry ∓ 1.8 × ATR(14)
- Take Profit: entry ± 3.2 × ATR(14) — reward:risk ≈ 1.78 : 1
- Position Sizing: risk exactly 1% of account balance per trade, lot size derived from stop distance
- Exposure: one position at a time, max 10 entries per day, no averaging, no martingale
[tv_analysis symbol=”XAUUSD”]
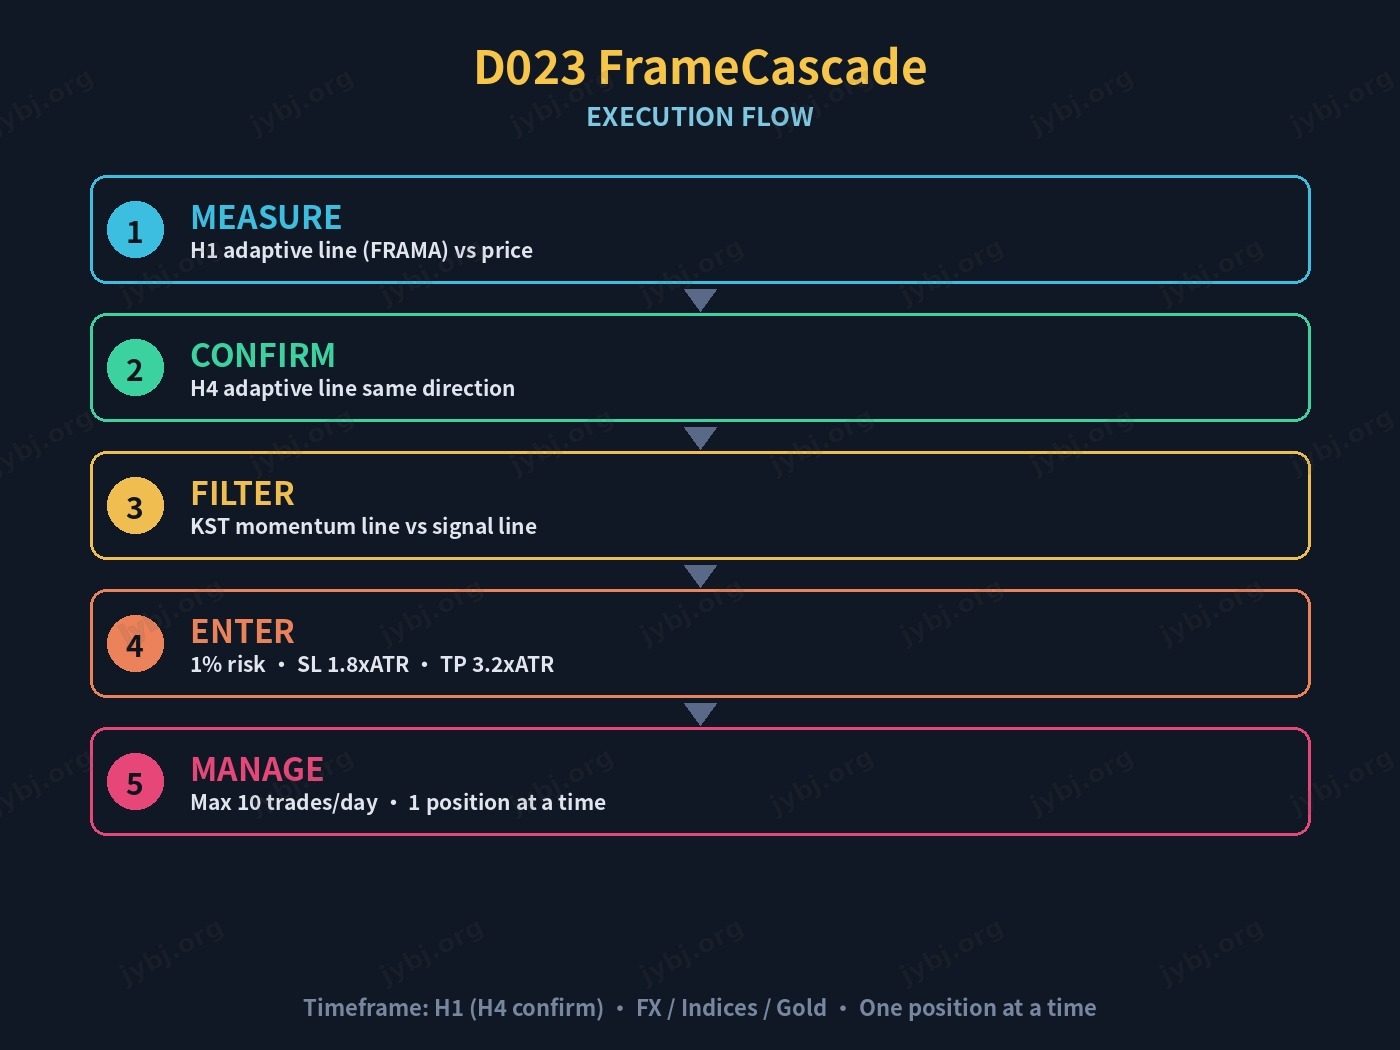
Execution Flow 执行流程
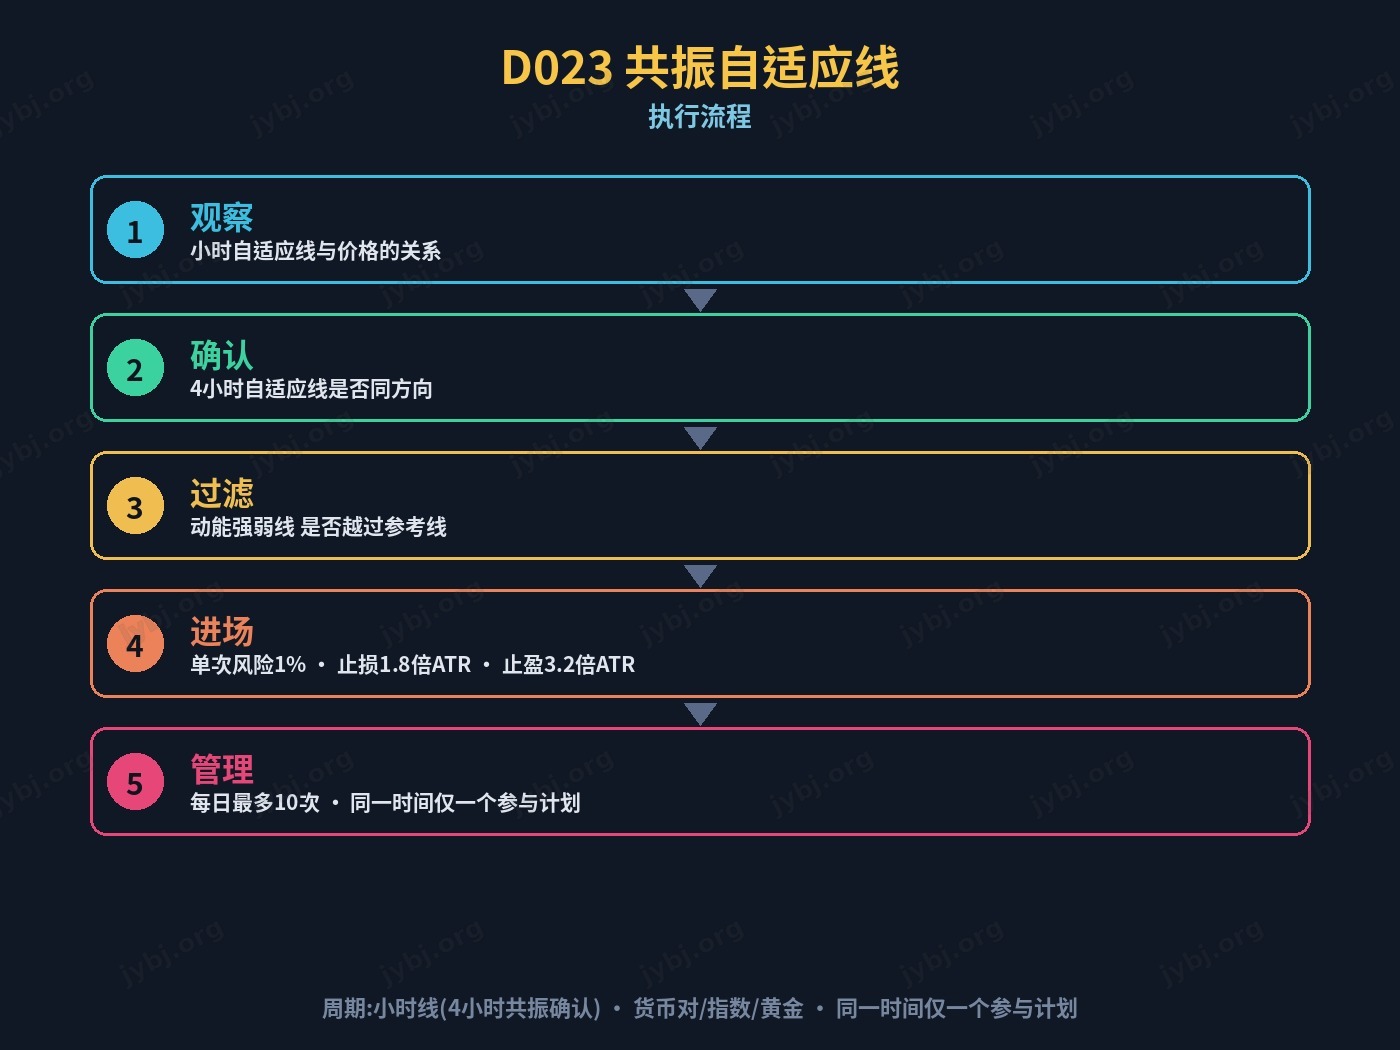
1MEASURETrack the H1 adaptive line (FRAMA) against price on every new bar.
2CONFIRMCheck that the H4 FRAMA is sloping the same direction (cross-timeframe resonance).
3FILTERRequire the KST momentum line to be on the correct side of its signal line.
4ENTEROpen with 1% risk, SL at 1.8×ATR, TP at 3.2×ATR.
5MANAGEHold until SL/TP; max 10 entries/day, one position at a time.
Full Parameter Set 参数设置
| Parameter | Value | Meaning |
|---|---|---|
| FRAMA Period (H1) | 16 | Adaptive line used for entry crosses |
| FRAMA Period (H4) | 16 | Same line on H4 for resonance confirmation |
| KST ROC Periods | 10 / 15 / 20 / 30 | Four rate-of-change lookbacks |
| KST Smoothing | 10 / 10 / 10 / 15 | Smoothing applied to each ROC before weighting |
| KST Signal Period | 9 | Simple average of KST used as the reference line |
| ATR Period | 14 | Volatility unit for stops and targets |
| Stop Loss | 1.8 × ATR | Initial protective stop |
| Take Profit | 3.2 × ATR | Fixed target, RR ≈ 1.78 |
| Risk per Trade | 1% | Of account balance |
| Max Trades / Day | 10 | Hard daily cap, resets next day |
| Timeframe | H1 entries, H4 confirm | Designed and tested on H1 |
| Markets | Gold, major FX, indices | Liquid instruments preferred |
| Signal Frequency (tested) | ~1.35–1.44 / day | 500-day synthetic H1 Monte-Carlo, 5 seeds |
[tv_calendar]
Strengths & Limitations
Strengths
- Cross-timeframe resonance filter reduces counter-trend entries
- FRAMA adapts its own speed to market roughness, reducing whipsaw
- All risk parameters scale with ATR — portable across symbols
- Only 3 parallel filters — transparent and easy to audit
Limitations
- Needs both H1 and H4 history available on the chart
- Resonance filter can delay entries at the very start of new trends
- FRAMA period may need tuning per symbol/timeframe
- Backtest thoroughly before any live deployment
Risk Disclaimer: This material is for educational purposes only and does not constitute investment advice.
Trading foreign exchange, gold, and indices carries a high level of risk and may not be suitable for all investors.
Past performance is not indicative of future results. Always test on a demo account first and never risk money you cannot afford to lose.
Strategy Visuals 图示说明
[tv_minichart symbol=”EURUSD”]
Source & Download
1. Place the EA file in
MQL5/Experts/ folder2. Add
https://jybj.org to WebRequest whitelist: Tools → Options → Expert Advisors → Allow WebRequest for listed URL3. One invite code = one account (non-transferable)
Ready to use · MT4 / MT5 · Parameters preconfigured 即开即用,参数已预设
Source code & compiled files: GitHub
Full documentation: Online strategy page
Live performance: View this strategy live →
Live Positions 实时持仓
[mt5_position magic=1046]
Related Trading Strategies
Want to compare more automated strategies? These related ones are worth a look:
- D022 ChronoVIDYA Edge — related strategy — compare parameters and live positions
- D021 BrickFlow Rider — Renko Bricks + TRIX Momentum System — related strategy — compare parameters and live positions
- D020 VolumeTide — Volume Profile + Delta Flip Strategy — related strategy — compare parameters and live positions
D023 FrameCascade Trading Strategy FAQ
Which symbols and timeframe does D023 FrameCascade suit?
D023 FrameCascade adapts to major FX and gold symbols; validate on demo first. Fine-tune for your broker’s spread and leverage, and rely on demo results before going live.
How do I download and run the D023 FrameCascade MT4/MT5 EA?
The Source & Download section provides compiled MT4/MT5 files and source. Drop it into MT5’s Experts folder, restart, and attach it to a chart — parameters are preset.
What are the risks of the D023 FrameCascade trading strategy?
No trading strategy guarantees profit; past and backtested results don’t predict the future. Run it on demo, cap per-trade and total risk, and understand the logic before trading live.
Further Reading
Risk Warning: The results shown are based on simulated or historical trading data. Past performance is not indicative of future results and does not constitute investment advice. Trading involves risk; please proceed with caution.
风险提示:本文所示为模拟/历史交易数据,过往表现不代表未来收益,不构成任何投资建议。